Periodic table
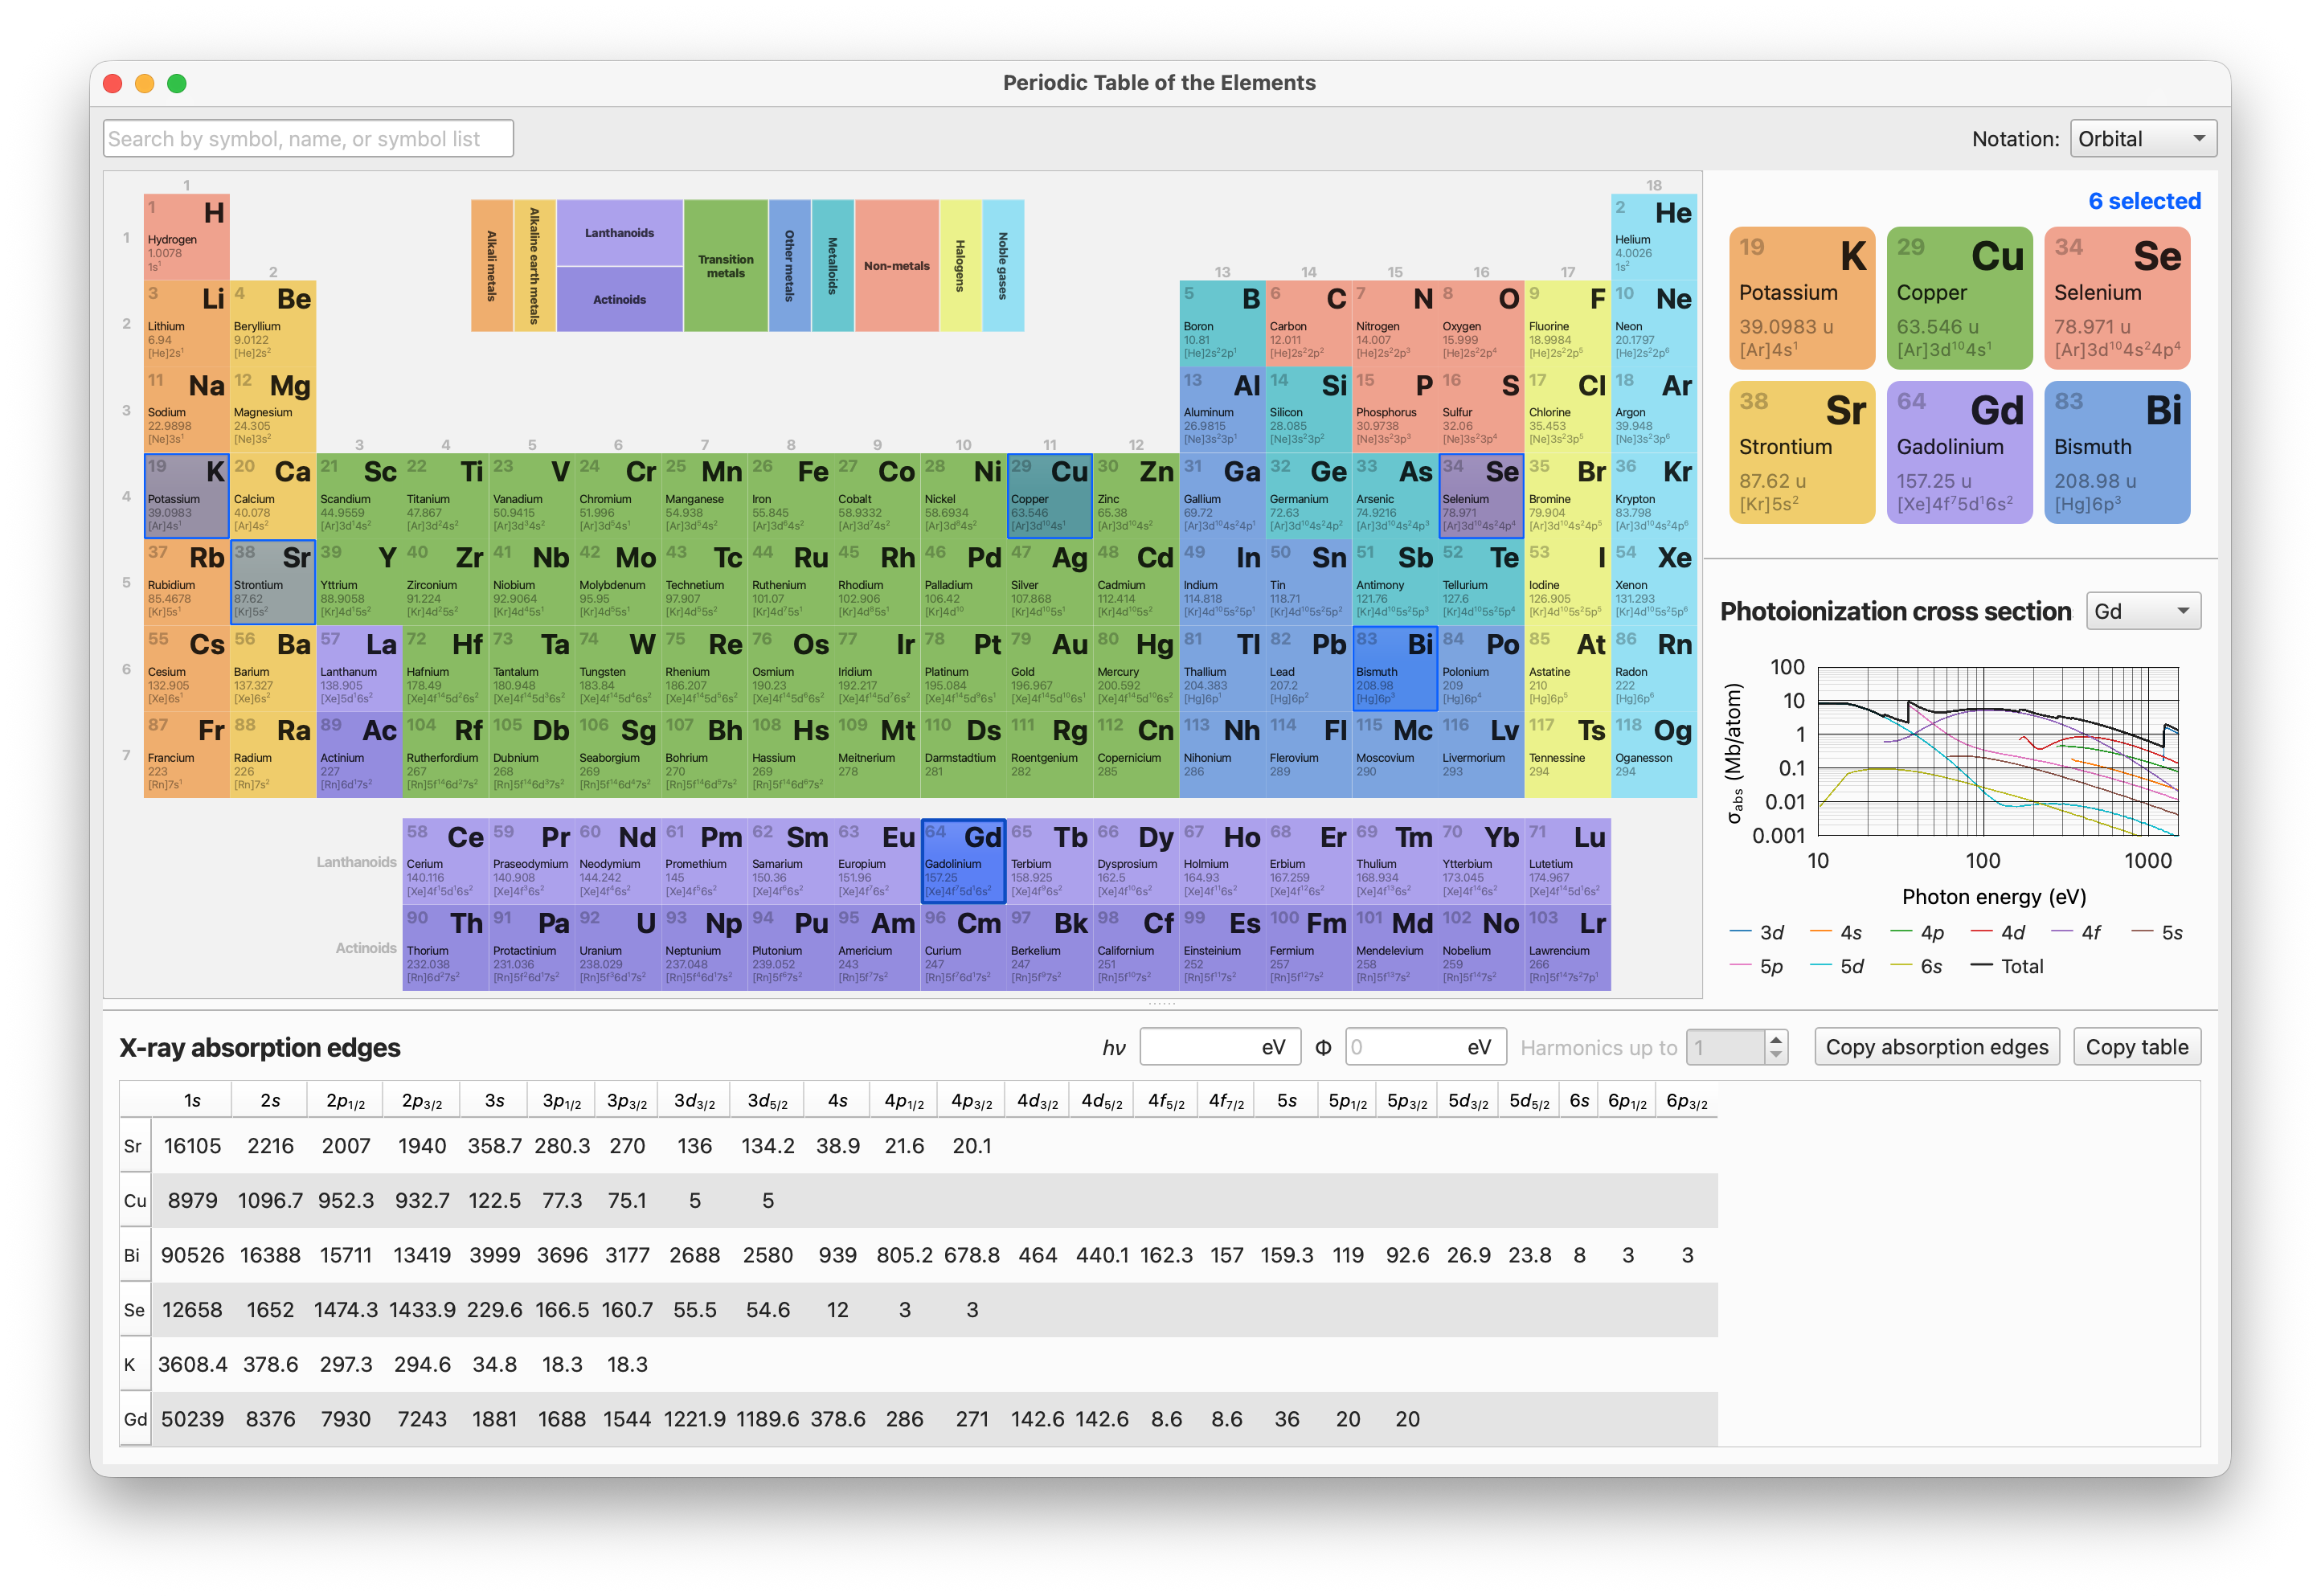
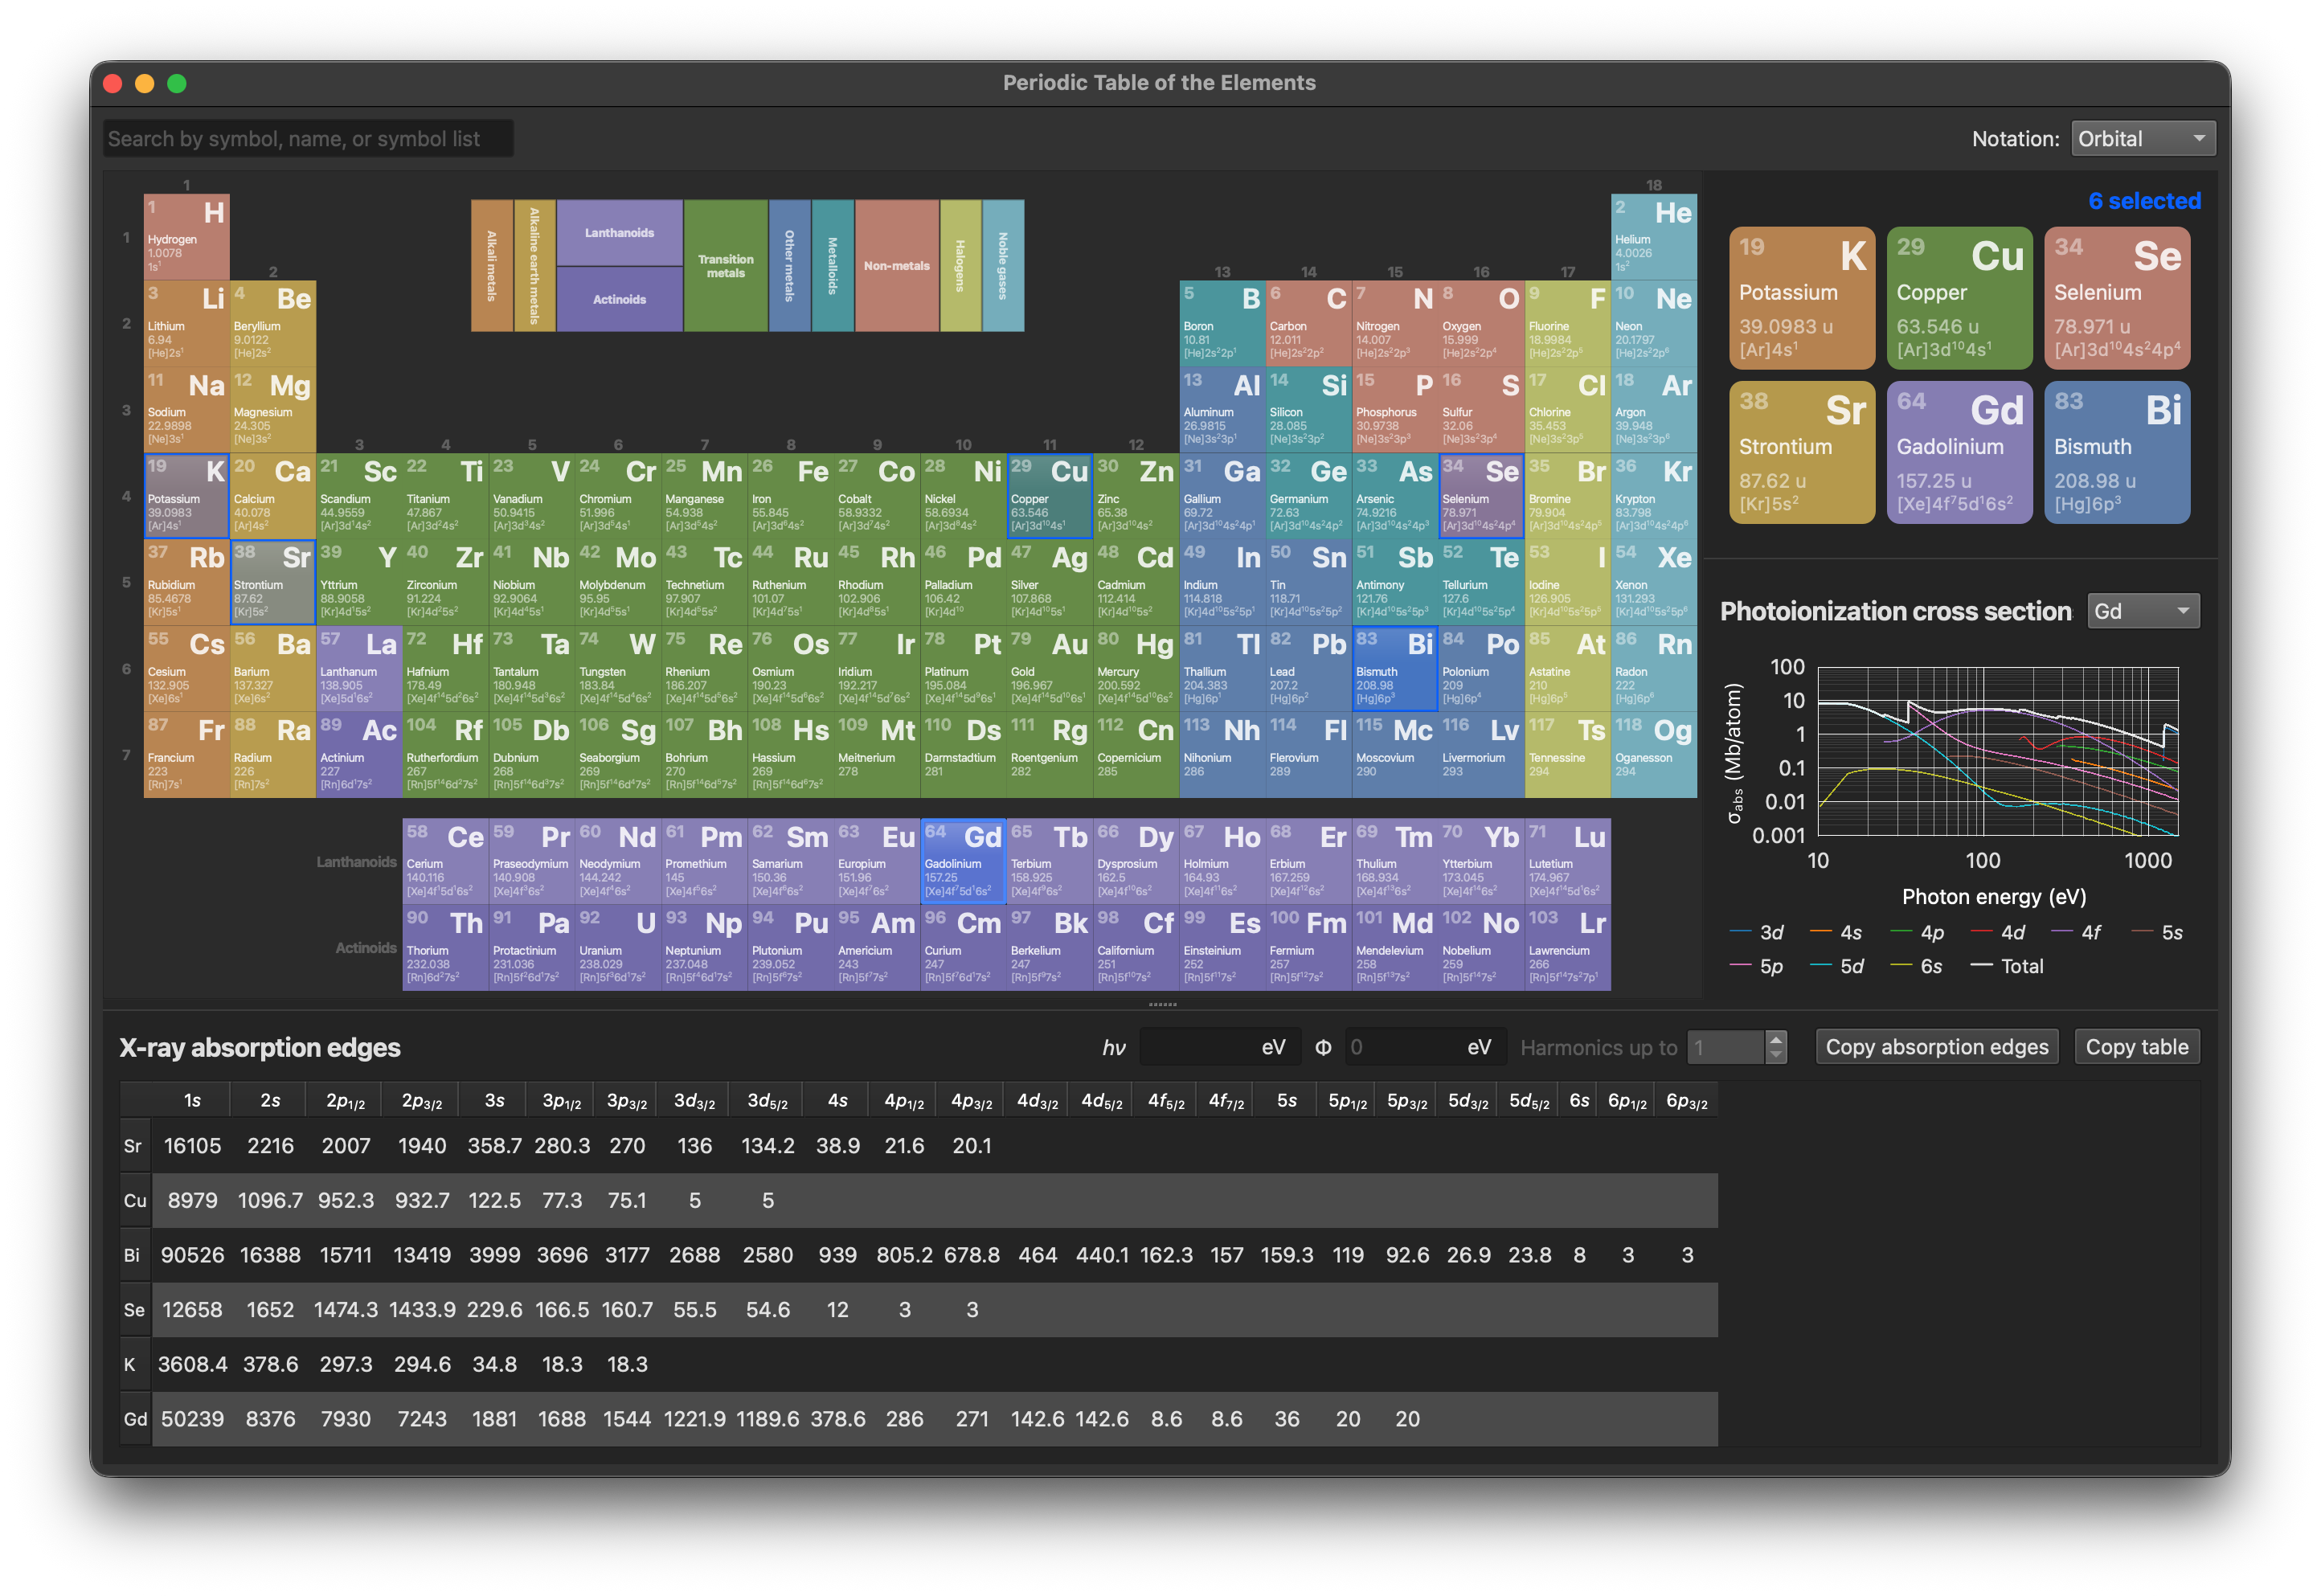
GUI that shows the periodic table of the elements. It provides orbital configurations, atomic masses, x-ray absorption-edge reference values, and photoionization cross sections. The absorption-edge values are often close to measured core-level binding energies. These data are useful for planning and interpreting core-level measurements.
ptable can be started with erlab.interactive.ptable():
import erlab.interactive as eri

eri.ptable()
It can also be started directly from the command line:
python -m erlab.interactive.ptable
In the ImageTool manager, you can open it from or with the keyboard shortcut Ctrl+Shift+P.
The search bar highlights matching elements by symbol or name and offers autocomplete suggestions that select the chosen element. Entering a comma- or space-separated list of exact symbols adds a multi-selection entry that selects all listed elements at once.
Hovering an element previews it in the side panel.
Clicking selects one element, and Ctrl/Cmd-click adds or removes elements from the selection. Clicking the table background clears the selection, and arrow keys move the current selection.
The spreadsheet below the periodic table lists x-ray absorption-edge reference values. These values can be used as approximate core-level binding energies. Chemical shifts and sample charging can move measured peaks away from the reference values. When a photon energy is entered, the table can also show kinetic energies.
Use Harmonics up to to calculate the kinetic energies for additional higher harmonics of the photon energy.
The side panel includes a log-log plot of photoionization cross sections for the selected element. If a photon energy is entered, the plot can also show markers for the fundamental and higher harmonics.