dtool
Interactive tool for visualizing dispersive data using derivative-based methods.
dtool can be started with erlab.interactive.dtool():
import erlab.interactive as eri

eri.dtool(data)
It can also be opened from the right-click context menu of any image plot in ImageTool.
The %dtool line magic (see Notebook shortcuts) provides the same entry point from notebooks.
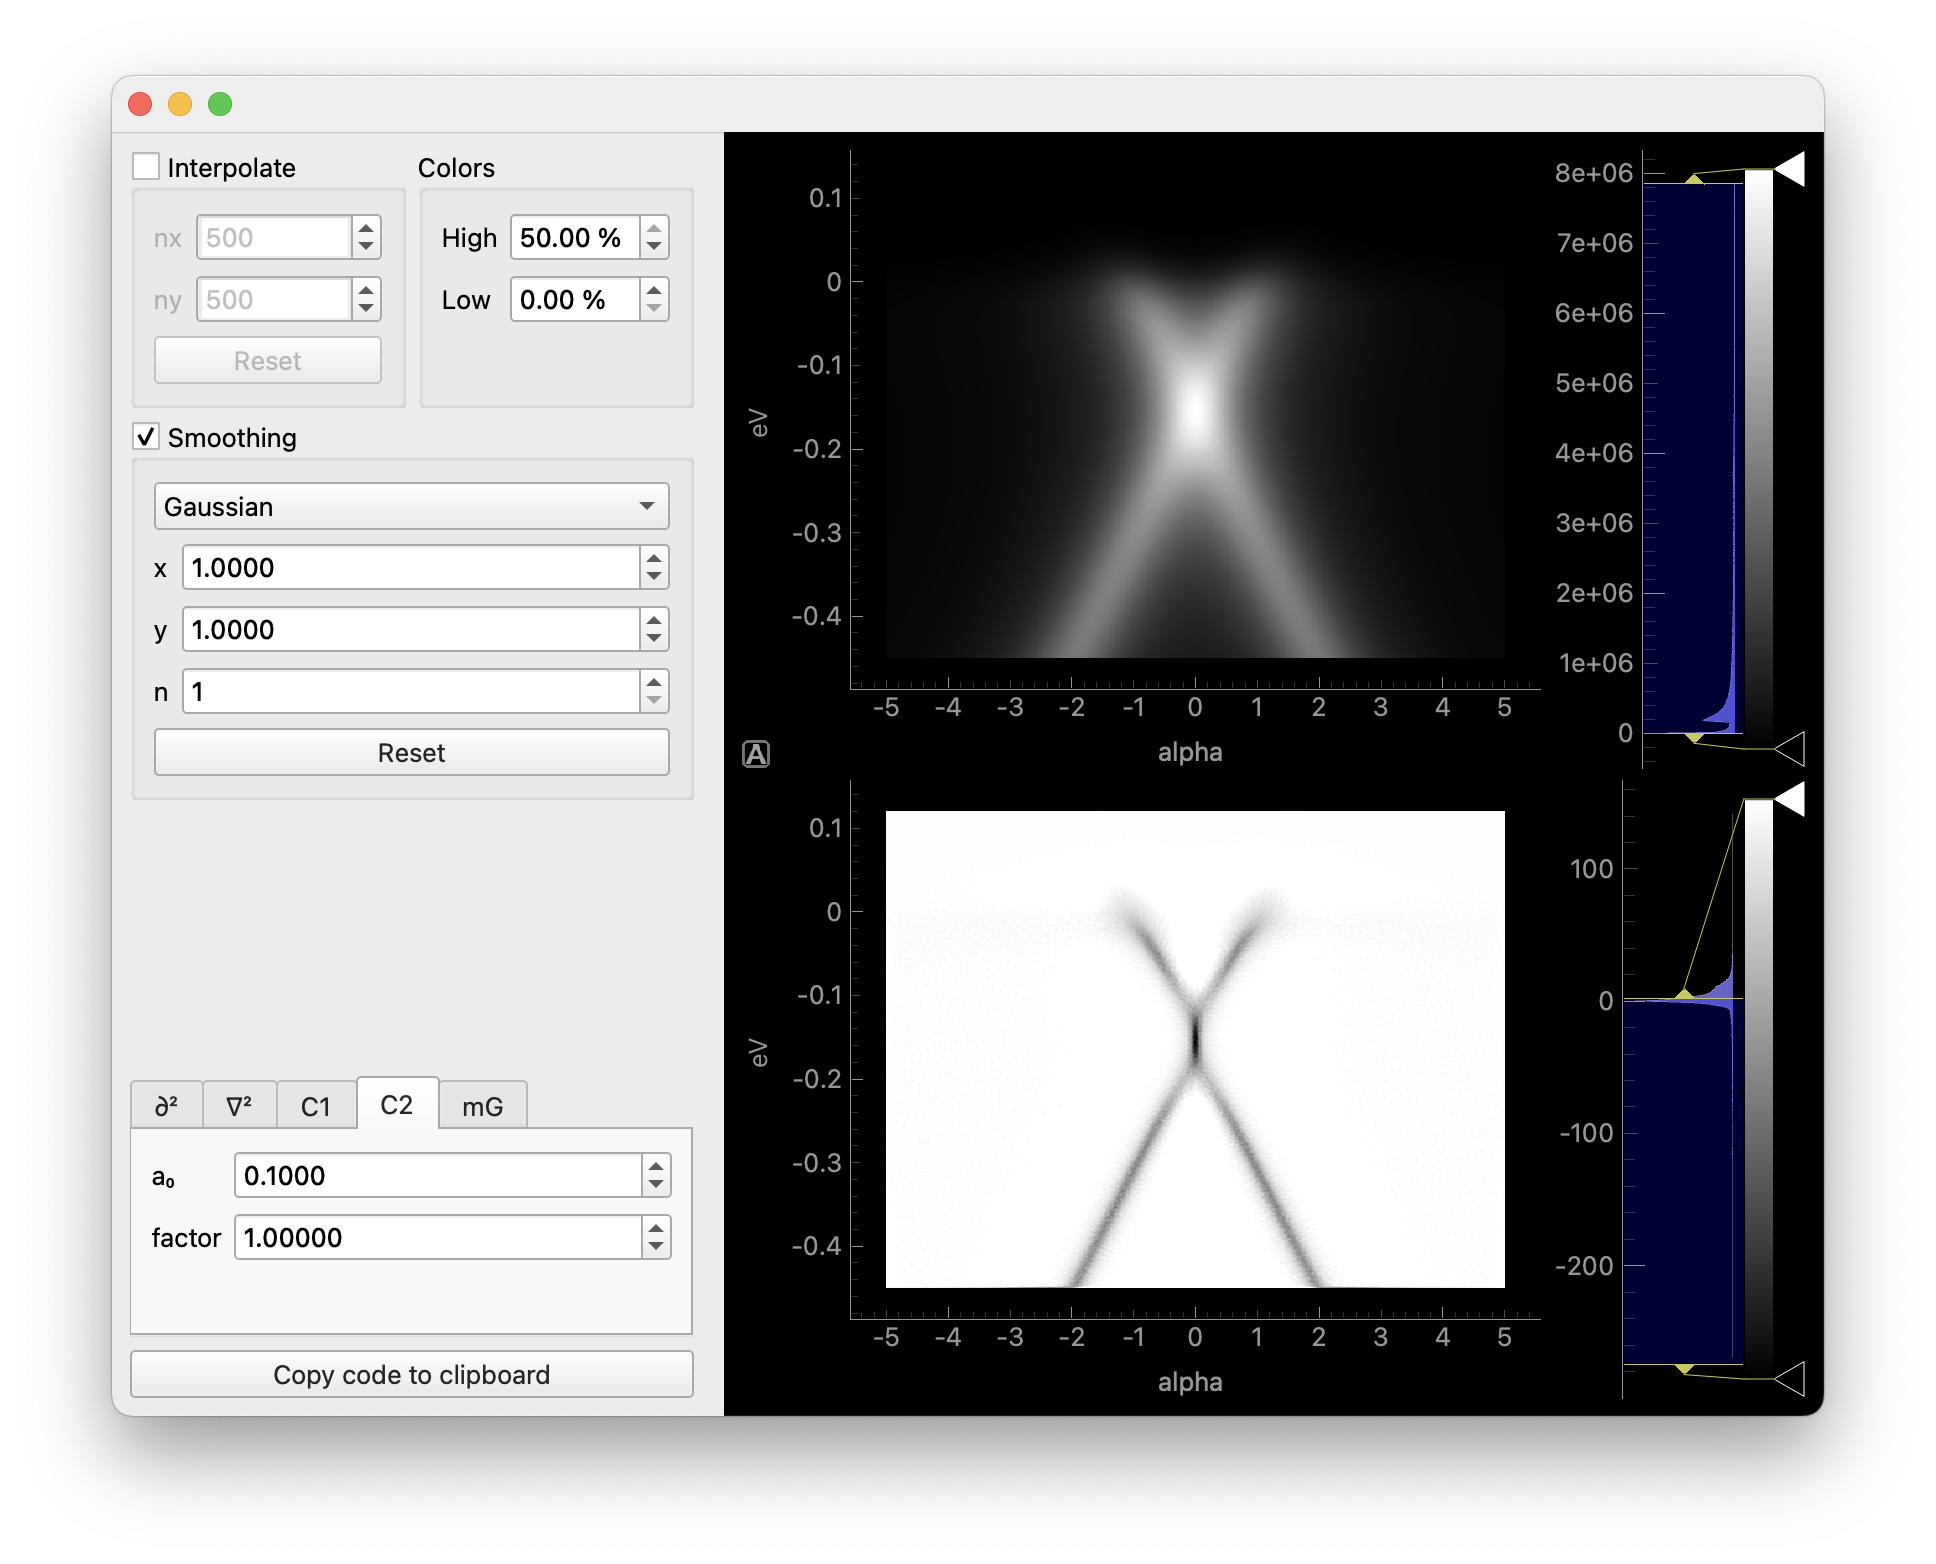
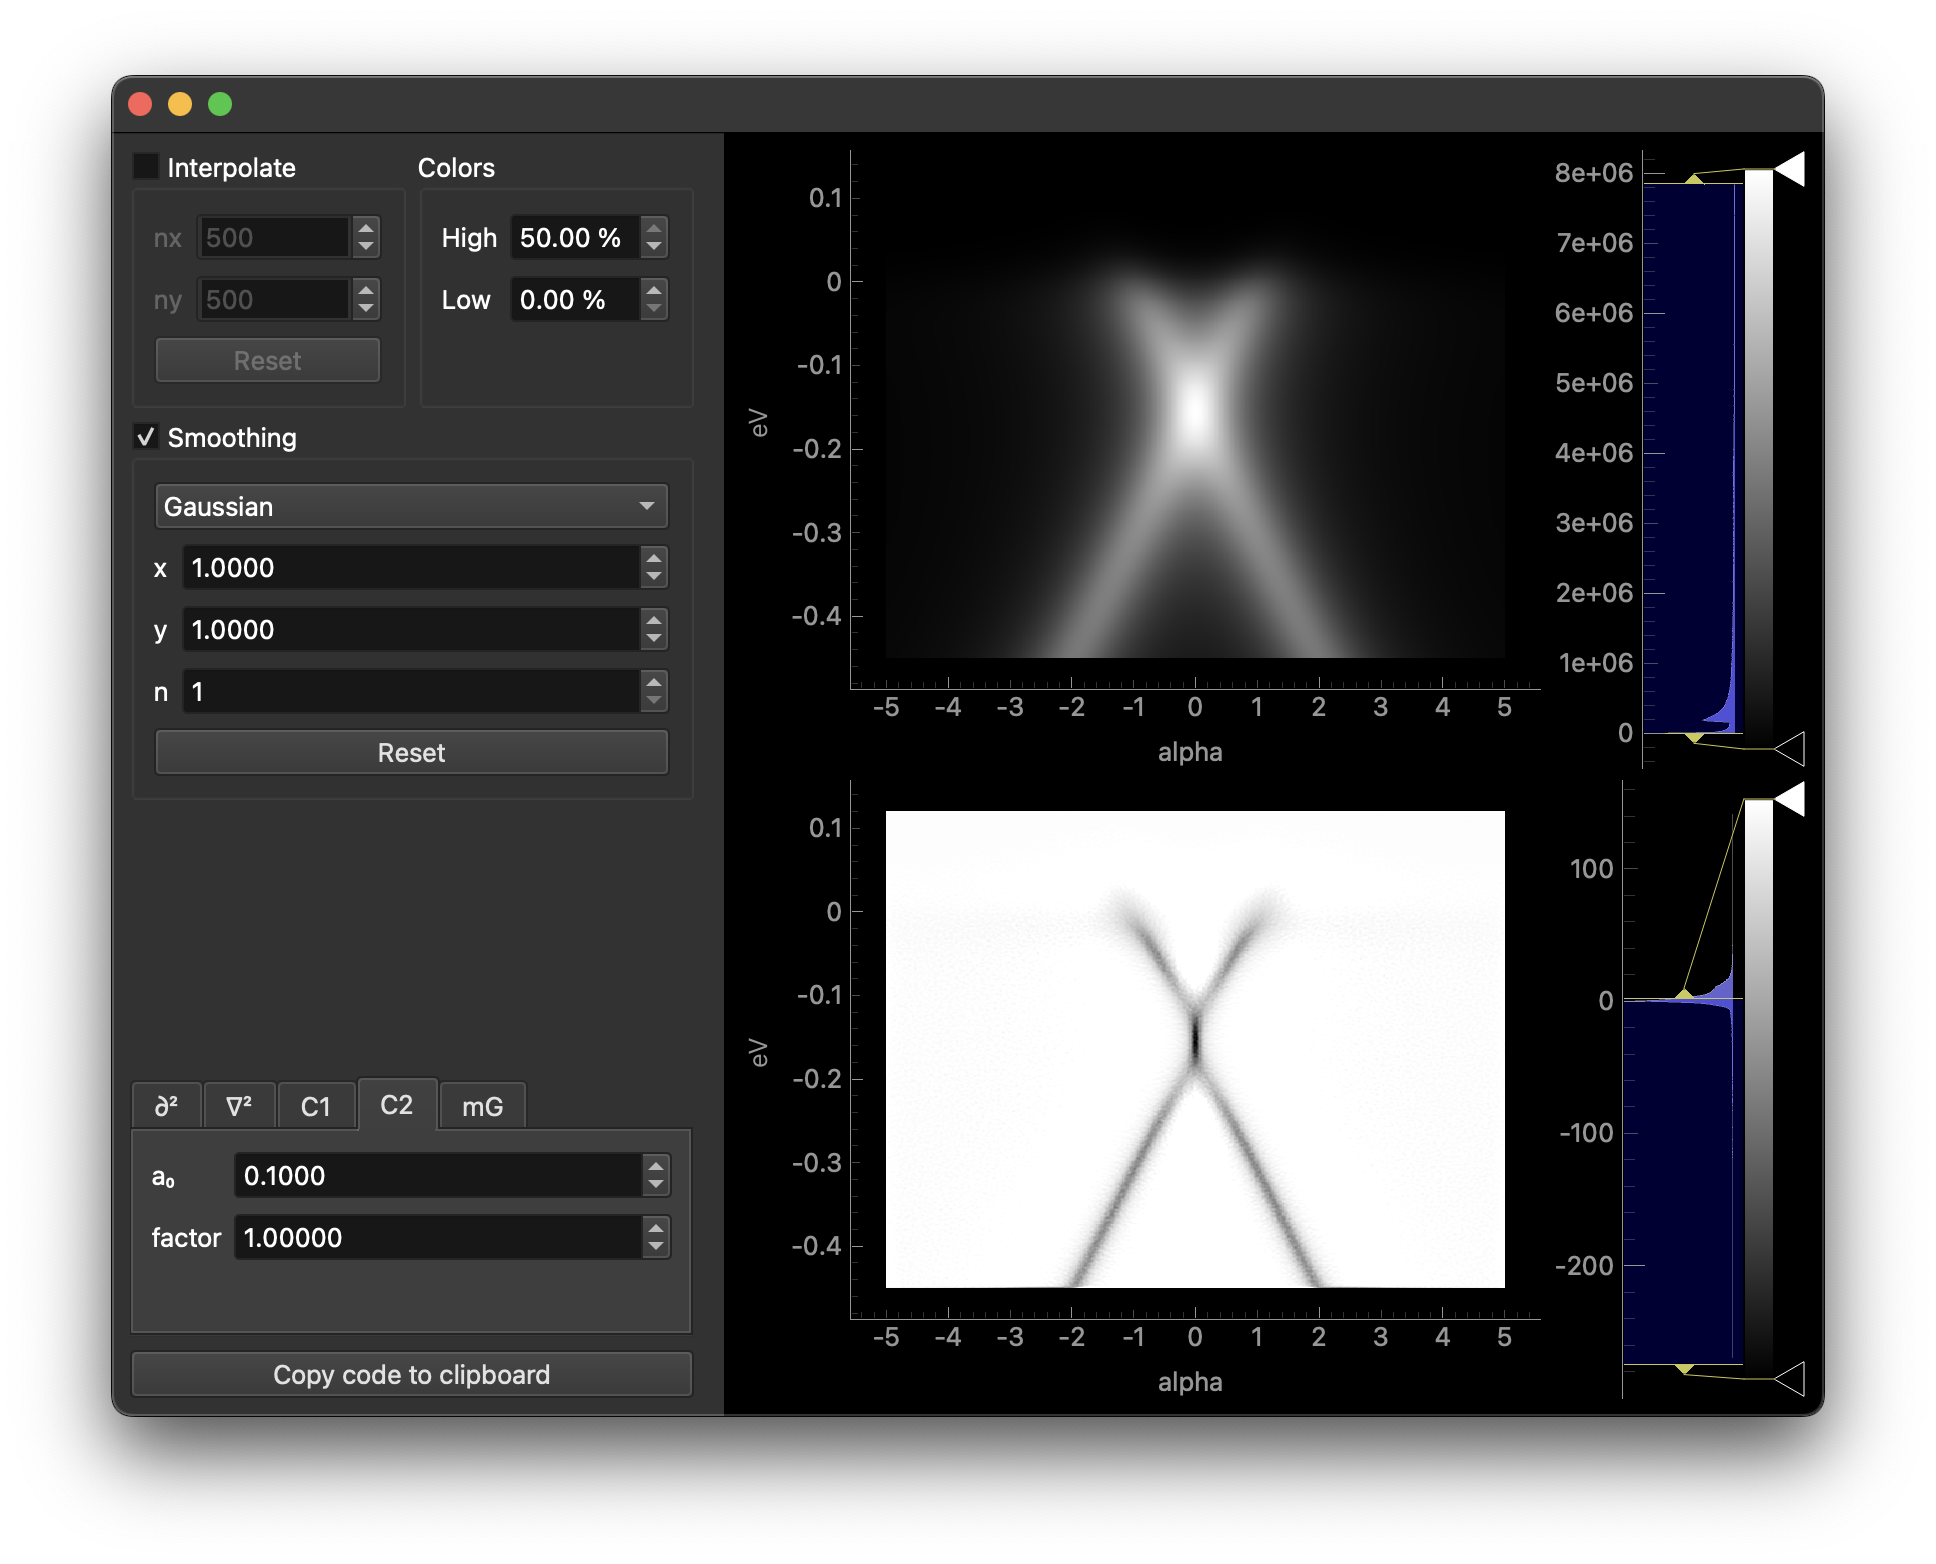
The first section interpolates the data to a grid prior to smoothing.
The second section applies smoothing prior to differentiation.
In the third section, selecting different tabs will apply different methods. Each tab contains parameters relevant to the selected method.
Clicking the copy button will copy the code for differentiation to the clipboard.
Both the smoothed data and the result can be opened in ImageTool from the right-click menu of each plot, where it can be analyzed further or saved to disk. When
dtoolwas opened from an ImageTool in the manager, these ImageTool windows stay underdtoolin the manager tree and can be updated when the ImageTool that openeddtoolchanges.