ImageTool
Inspired by Image Tool for Igor Pro, developed by the Advanced Light Source at Lawrence Berkeley National Laboratory, ImageTool delivers the same efficient workflow, now enhanced by xarray and Python.
Key capabilities
Responsive slicing of multidimensional (up to 4D)
DataArrayobjects, including Dask-backed data.Unlimited number of cursors with independent binning and code export for each line cut.
Rich colormap controls with power law scaling, symmetric scaling about a center, and live color range adjustment.
Built-in menus for selection, rotation, symmetrization, averaging, interpolation, cropping, coordinate reassignment, Fermi edge correction, and other common operations.
Tight integration with tools such as ktool, dtool, and other tools listed in Interactive tools, all accessible from ImageTool’s menus and context menus.
Seamless integration with ImageTool manager when you need to organize top-level ImageTool rows, tools opened from those ImageTools, ImageTool windows made by those tools, shared workspaces, or synchronized Jupyter notebooks.
For launch and notebook integration procedures, see Opening Python data in ImageTool.
Opening ImageTool
ImageTool accepts these Python entry points:
xarray.DataArray.qshow()opens a DataArray:data.qshow(link=True)
erlab.interactive.imagetool.itool()opens one object or a list of objects:import erlab.interactive as eri eri.itool(data, cmap="cividis")
A list creates multiple windows. Set
link=Trueto synchronize their cursor positions and bins. A Dataset or DataTree with multiple valid variables opens a variable-selection dialog.The
%itoolIPython magic opens a variable from the current namespace:%load_ext erlab.interactive %itool data
The
-mor--manageroption sends the new window to ImageTool Manager. Use%itool --helpor%itool?for the complete option list.The ERLab extension for VS Code also opens DataArrays in ImageTool. The extension is also available from Open VSX.
ImageTool adds a display axis for one-dimensional input. Singleton dimensions do not count toward the four-dimensional limit. Input with more than four effective dimensions opens the Reduce Dimensions to Open dialog. Each dimension can be kept, reduced to one value, or aggregated. The dialog shows the resulting dimensions and generated Python code before it opens the data.
Interface tour
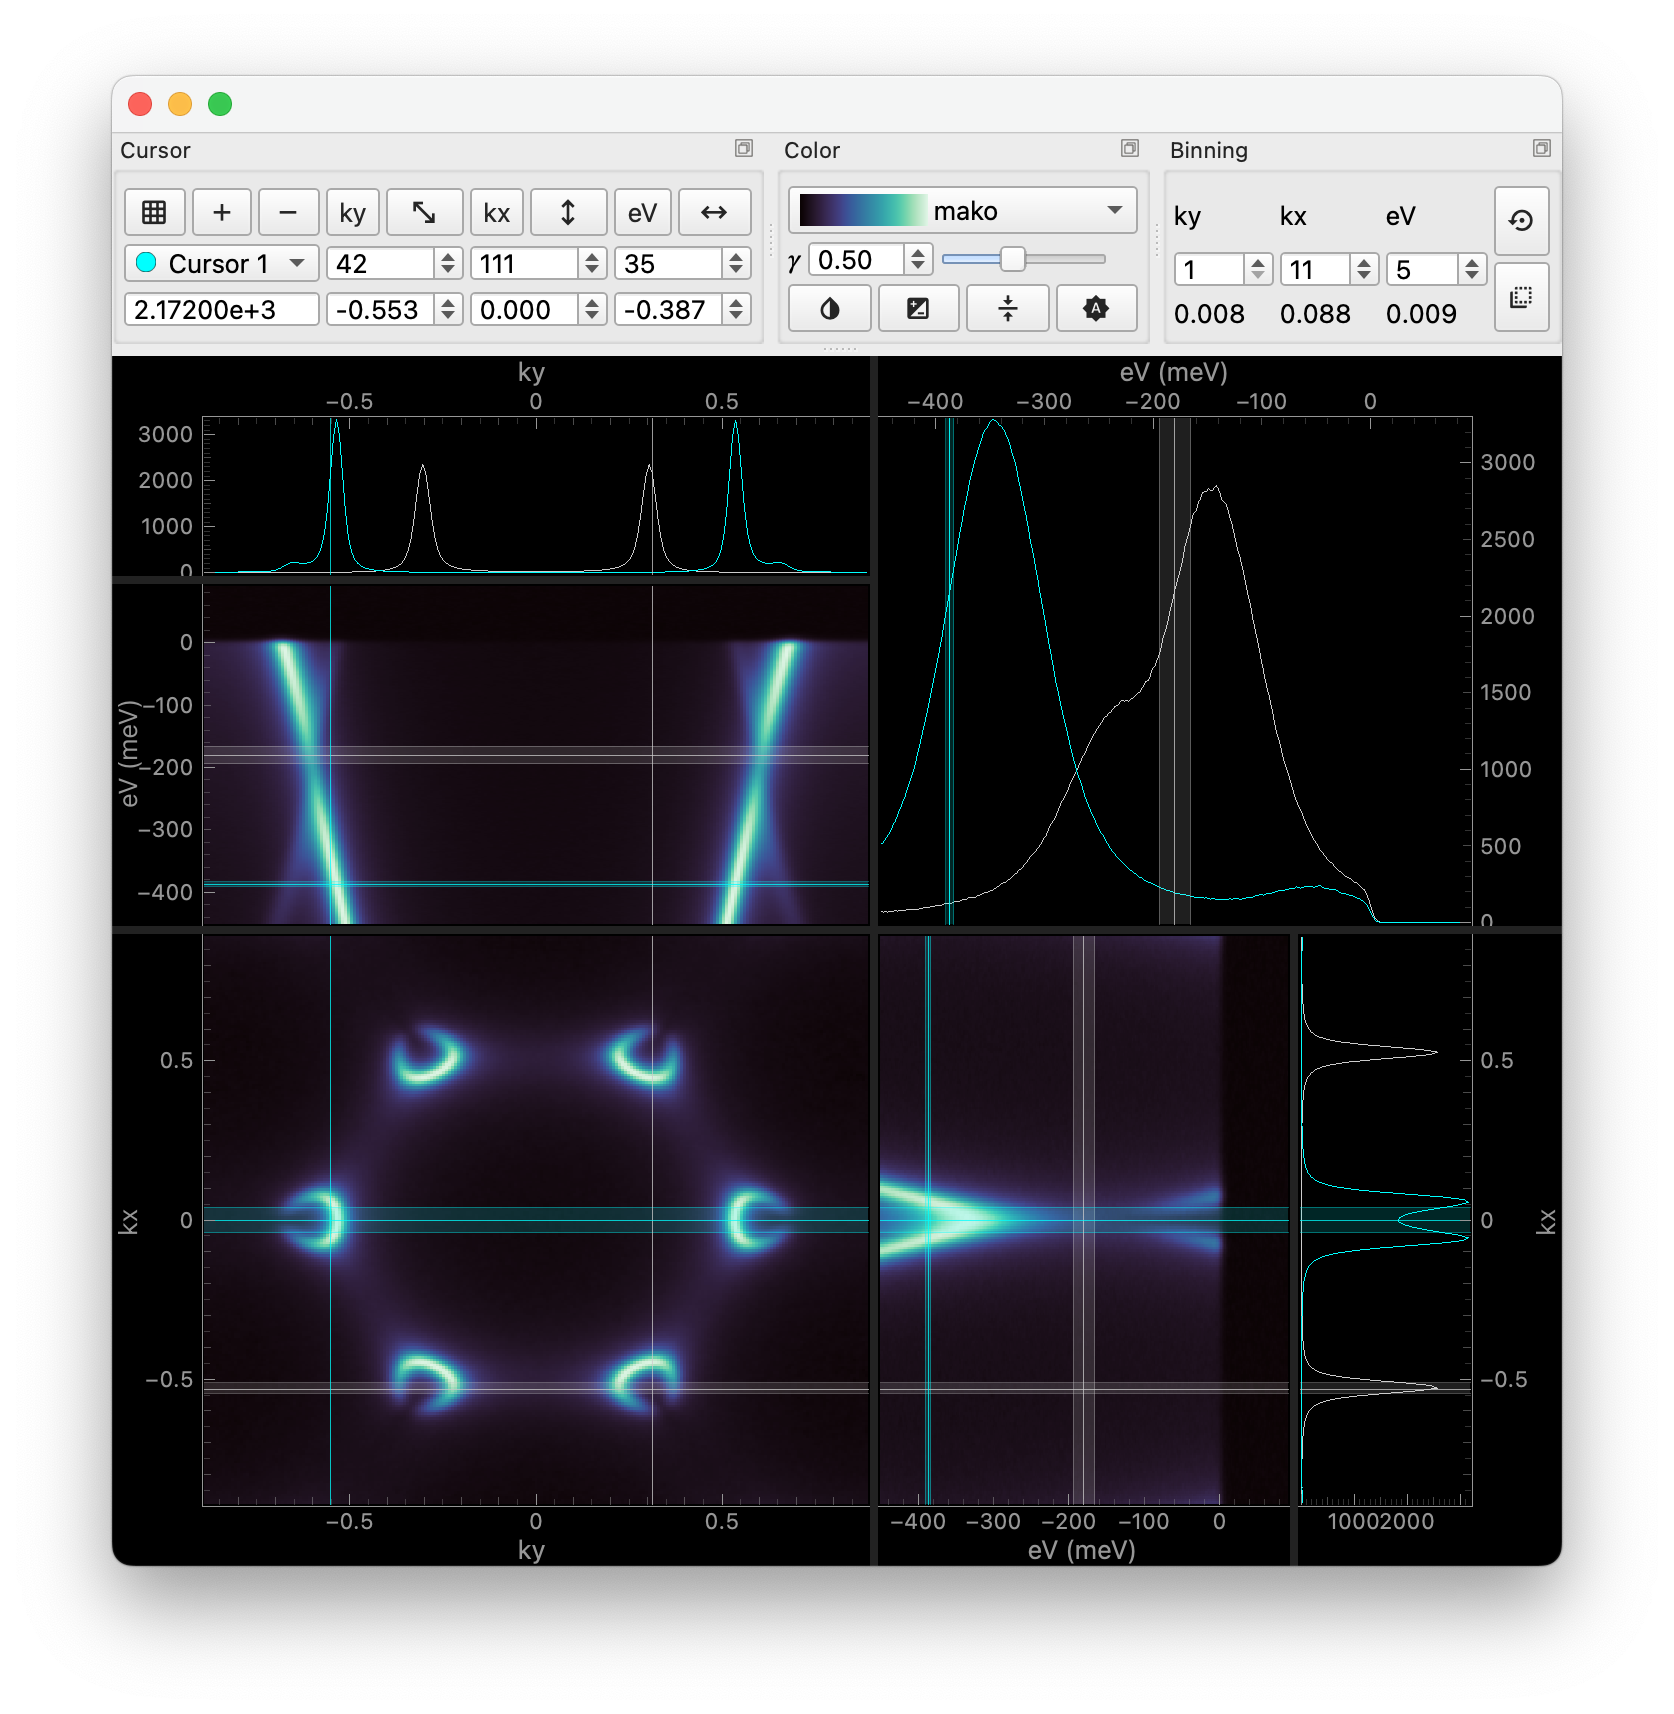

Every ImageTool window is built from an ImageSlicerArea plus dockable control panels:
Main image and cross-sections – The central plot renders the current 2D slice. Orthogonal slices and cursor readouts update in real time as you move the cursors.
Cursor panel – Add, remove, and modify cursors here. The coordinates of the active cursor are shown in editable text boxes.
Color panel – Manipulate colormap normalization and appearance.
Binning panel – Set bin widths per dimension and reset them with . Changes to the bin widths you make while is toggled are applied to all cursors.
Working with dimensions and coordinates
ImageTool accepts image-like data with two to four effective dimensions. An effective
dimension has more than one value. One-dimensional input gains a display axis, and
singleton dimensions do not count toward the limit. Supported inputs include NumPy
arrays, xarray.DataArray, xarray.Dataset, and
xarray.DataTree. Inputs with more than four effective dimensions open a
reduction dialog before ImageTool creates a window.
The order of dimensions can be swapped using the arrow buttons in the cursor panel. The arrow points to the slice that will swap with the main view.
Non-uniform coordinates are converted with a
_idxsuffix for plotting. Their true values are displayed in the cursor readouts.Use to open the Coordinate Editor dialog. This dialog is an interface for
xarray.DataArray.assign_coords(). Use the dialog to do these actions:Set the start and end values.
Edit individual values.
Scale and offset a numeric scalar or 1D coordinate with
new = scale * old + offset.Add a scalar coordinate.
Add a 1D associated coordinate along an existing dimension.
Use to open the Attribute Editor dialog. This is a GUI for
xarray.DataArray.assign_attrs()that lets you change existing attributes or add new typed attributes while leaving untouched attributes in place. Choose String, Int, Float, Bool, or Python literal when entering values.Use to open the Rename Coordinates and Dimensions dialog. This is a GUI for
xarray.DataArray.rename()that lets you rename coordinates and dimensions.Use to open the Swap Dimensions dialog. This is an interface for
xarray.DataArray.swap_dims().Dask-backed arrays are fully supported. The dedicated Dask menu exposes actions to compute the array into memory, rechunk automatically, or choose custom chunk shapes within ImageTool.
Overlay plots of numeric non-dimensional coordinates, such as temperature, on profile plots from . Multi-dimensional coordinates are sliced with the active cursor and averaged over binned hidden dimensions. Right-click a profile plot to open associated coordinates in a new ImageTool window.
Use to color cursors by a dimension coordinate or numeric associated coordinate value at each cursor position.
Slicing and binning
Drag with the left mouse button to pan. Drag with the right mouse button or use the wheel to zoom. Scroll on an individual axis to zoom only that dimension.
Drag a cursor line to change the slicing position. You can also hold Command on macOS or Ctrl on other platforms, and then drag on a plot. The submenu lists keyboard commands for moving the active cursor.
Binning displays the average over the selected bin width. Shaded regions beside the cursor lines show the averaged range. Binning does not change the stored data.
and Coarsen reduce the underlying data. Use these operations when the result must contain fewer data points.
For a procedure that synchronizes slices and bins across windows, see Comparing data in linked ImageTools.
Data operations
Editing dialogs are available from the Edit and View menus. Most editing dialogs can replace the current data or open the result separately. When ImageTool is managed, Result Placement can create a child row, create a top-level row, or replace the current row.
applies
erlab.analysis.transform.rotate(). A visible rotation guideline supplies the initial angle and center.builds selections with
xarray.DataArray.qsel(),xarray.DataArray.sel(), orxarray.DataArray.isel().reduces selected dimensions with mean, minimum, maximum, or sum.
calls
xarray.DataArray.interp()along one dimension withlinearornearestinterpolation.calls
xarray.DataArray.sortby()with one or more coordinate keys.calls
erlab.analysis.interpolate.leading_edge()along a selected dimension.provides window, boundary, side, coordinate, and reduction controls for
xarray.DataArray.coarsen().calls
xarray.DataArray.thin().applies reflection or antisymmetrization about a selected coordinate.
applies rotational symmetrization. A visible rotation guideline supplies the initial center and fold count.
selects data between cursors. selects the visible coordinate range.
shifts data along one dimension with a scalar or a compatible ImageTool in the same Manager. A managed ImageTool source is recorded as a second input to the result. The operation uses
erlab.analysis.transform.shift().loads a saved fit with
xarray_lmfit.load_fit()and applieserlab.analysis.gold.correct_with_edge().applies a reversible display filter with area, min-max, and baseline options.
applies a reversible, coordinate-aware Gaussian display filter.
and move through editing history. removes the active display filter. Opening the active filter dialog again starts from and replaces its current settings.
See Fermi edge correction for the Manager workflow that applies a fitted reference edge to another measurement.
Color and normalization
Toggle to lock the color range to the global data min/max and display a colorbar alongside the image. Drag on the colorbar to update limits interactively or right-click to type exact bounds.
applies gamma scaling relative to the midpoint, which is handy for centered intensity scales such as spin-polarized or dichroic data.
Use to flip between normalization behaviors of
matplotlib.colors.PowerNormanderlab.plotting.colors.InversePowerNorm.By default, only a subset of Matplotlib colormaps is loaded. You can load the whole catalog by right-clicking on the colormap drop-down and selecting Load All Colormaps.
For ROI procedures, see Extracting data along a polygonal path and Masking data with a polygonal ROI.
For export and settings procedures, see Saving ImageTool data to a file.
Keyboard shortcuts
Most actions advertise their shortcut directly in the menu bar. The table below highlights common gestures. Replace Ctrl with ⌘ and Alt with ⌥ on macOS.
Shortcut |
Description |
|---|---|
LMB Drag |
Pan |
RMB Drag |
Zoom and scale |
Ctrl+LMB Drag |
Move active cursor |
Ctrl+Alt+LMB Drag |
Move all cursors simultaneously |
Alt while dragging a cursor line |
Move all cursor lines along |
Rule of thumb: hold Alt to apply actions to all cursors. Shortcuts for ‘shifting’ a cursor involves the Shift key.