ktool
Interactive conversion from angles to momentum space. ktool supports constant-energy
alpha/beta maps, angle-energy alpha/eV cuts with a fixed beta coordinate,
and 3D angle volumes.
There are four ways to start ktool.
xarray.DataArray.kspace.interactive()data.kspace.interactive()
-
This option is recommended because the name of the input data will be automatically detected and applied to the generated code that is copied to the clipboard.
import erlab.interactive as eri

eri.ktool(data)
From the ImageTool View menu
Click .
The button will be disabled if the data is not compatible with
ktool.When the ImageTool data contains both
alphaandbetadimensions, the normal emission values are set from the active cursor position.If a rotation guideline is visible on the main image, the guideline’s angle and center will be applied instead.
From IPython using the
%ktoolmagic described in Notebook shortcuts.
The GUI is divided into two tabs.
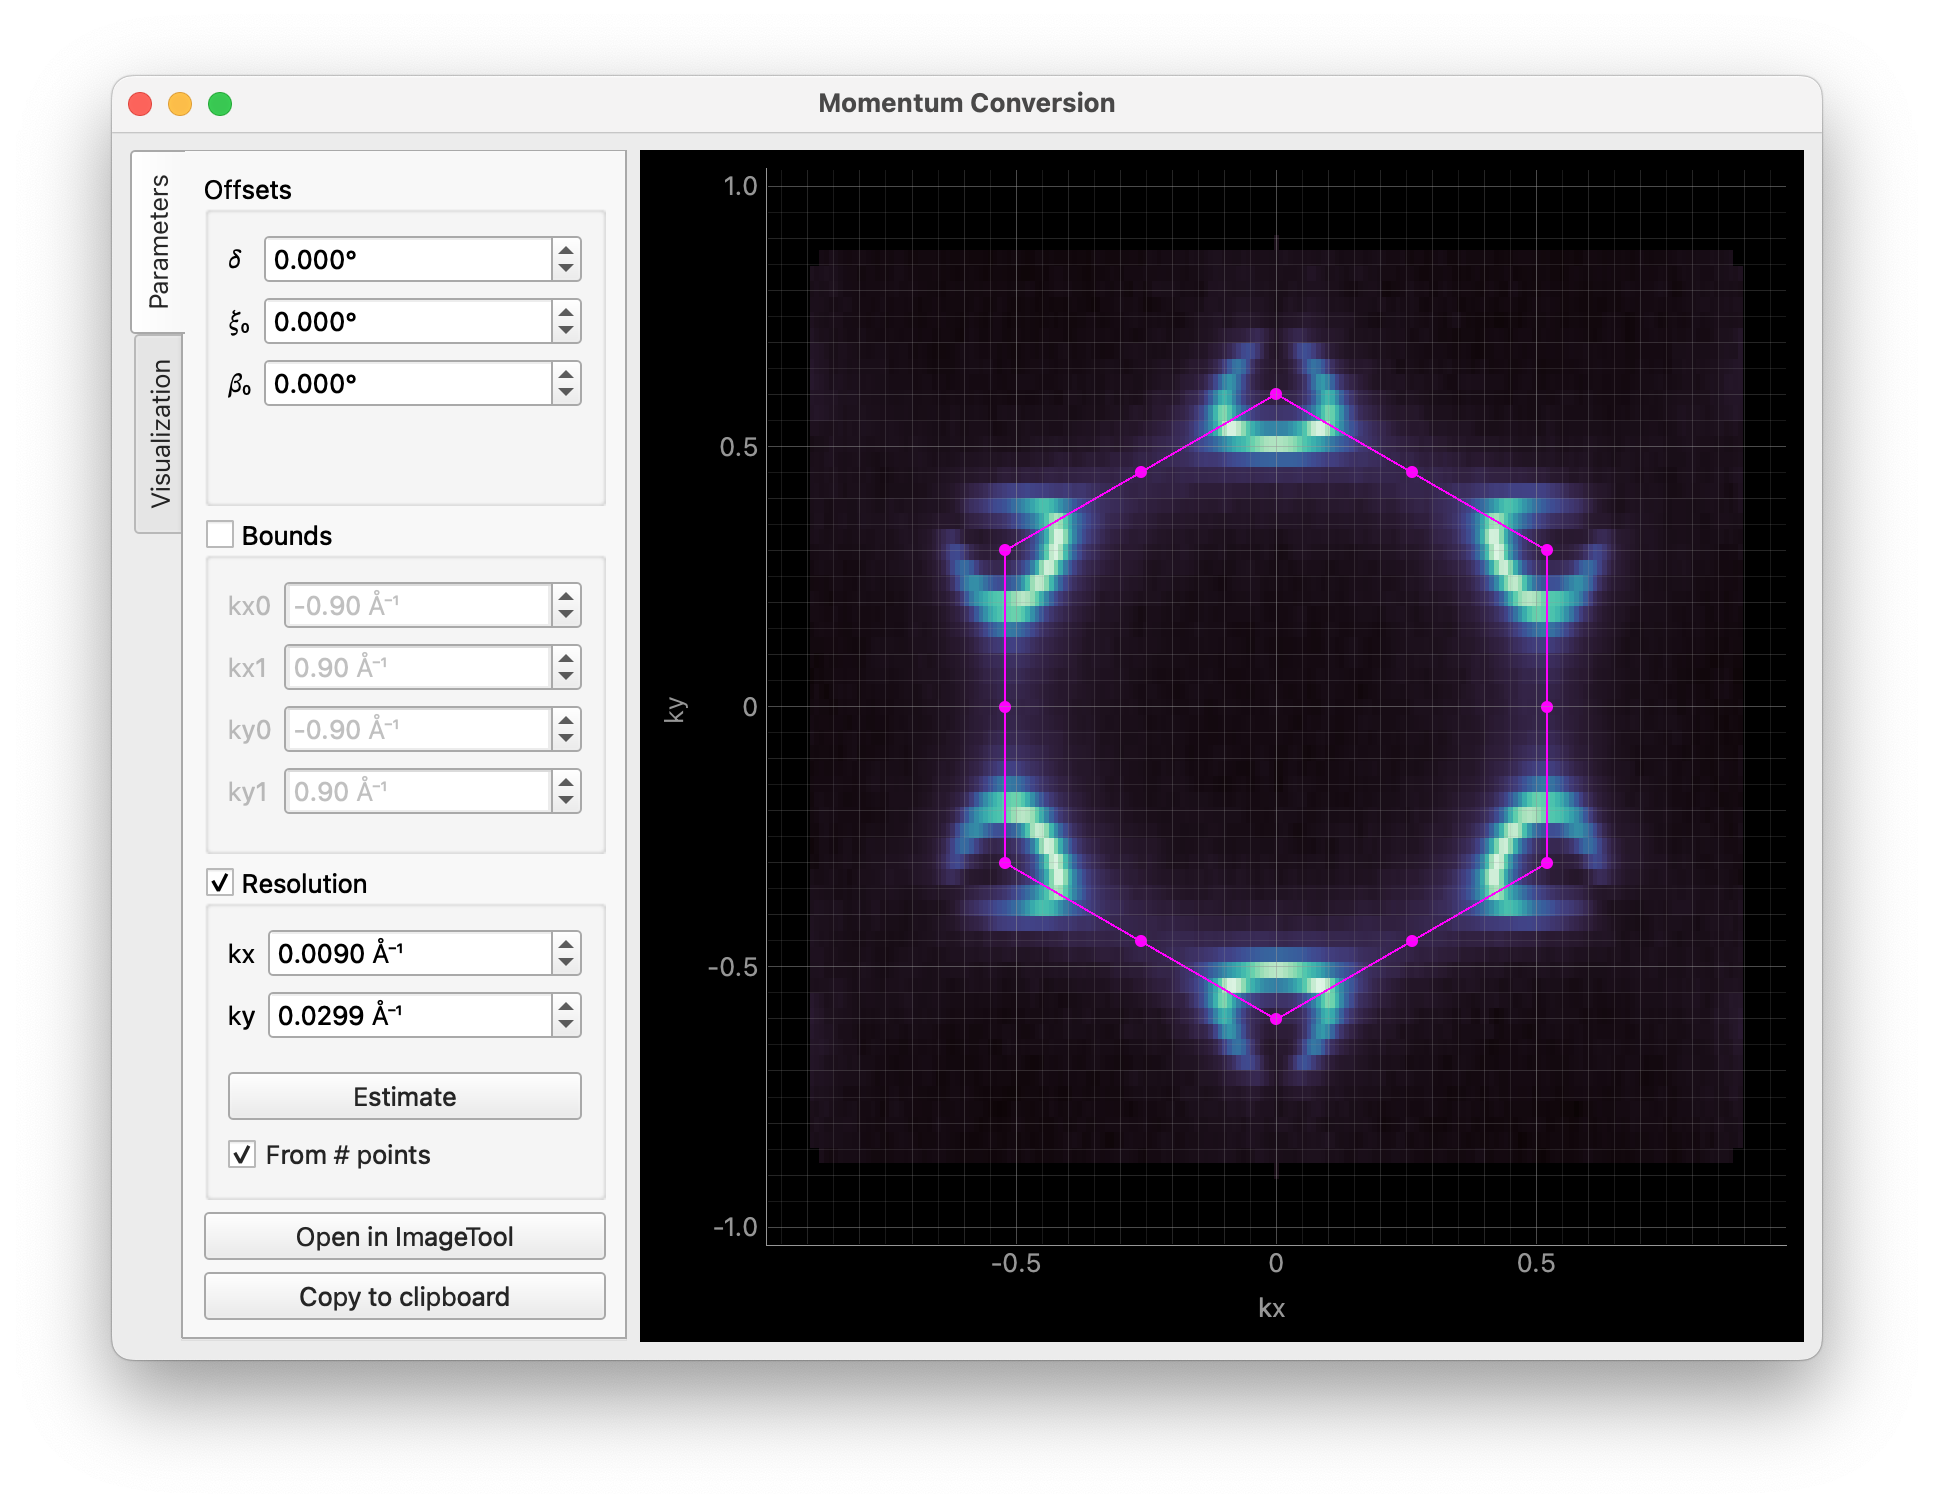
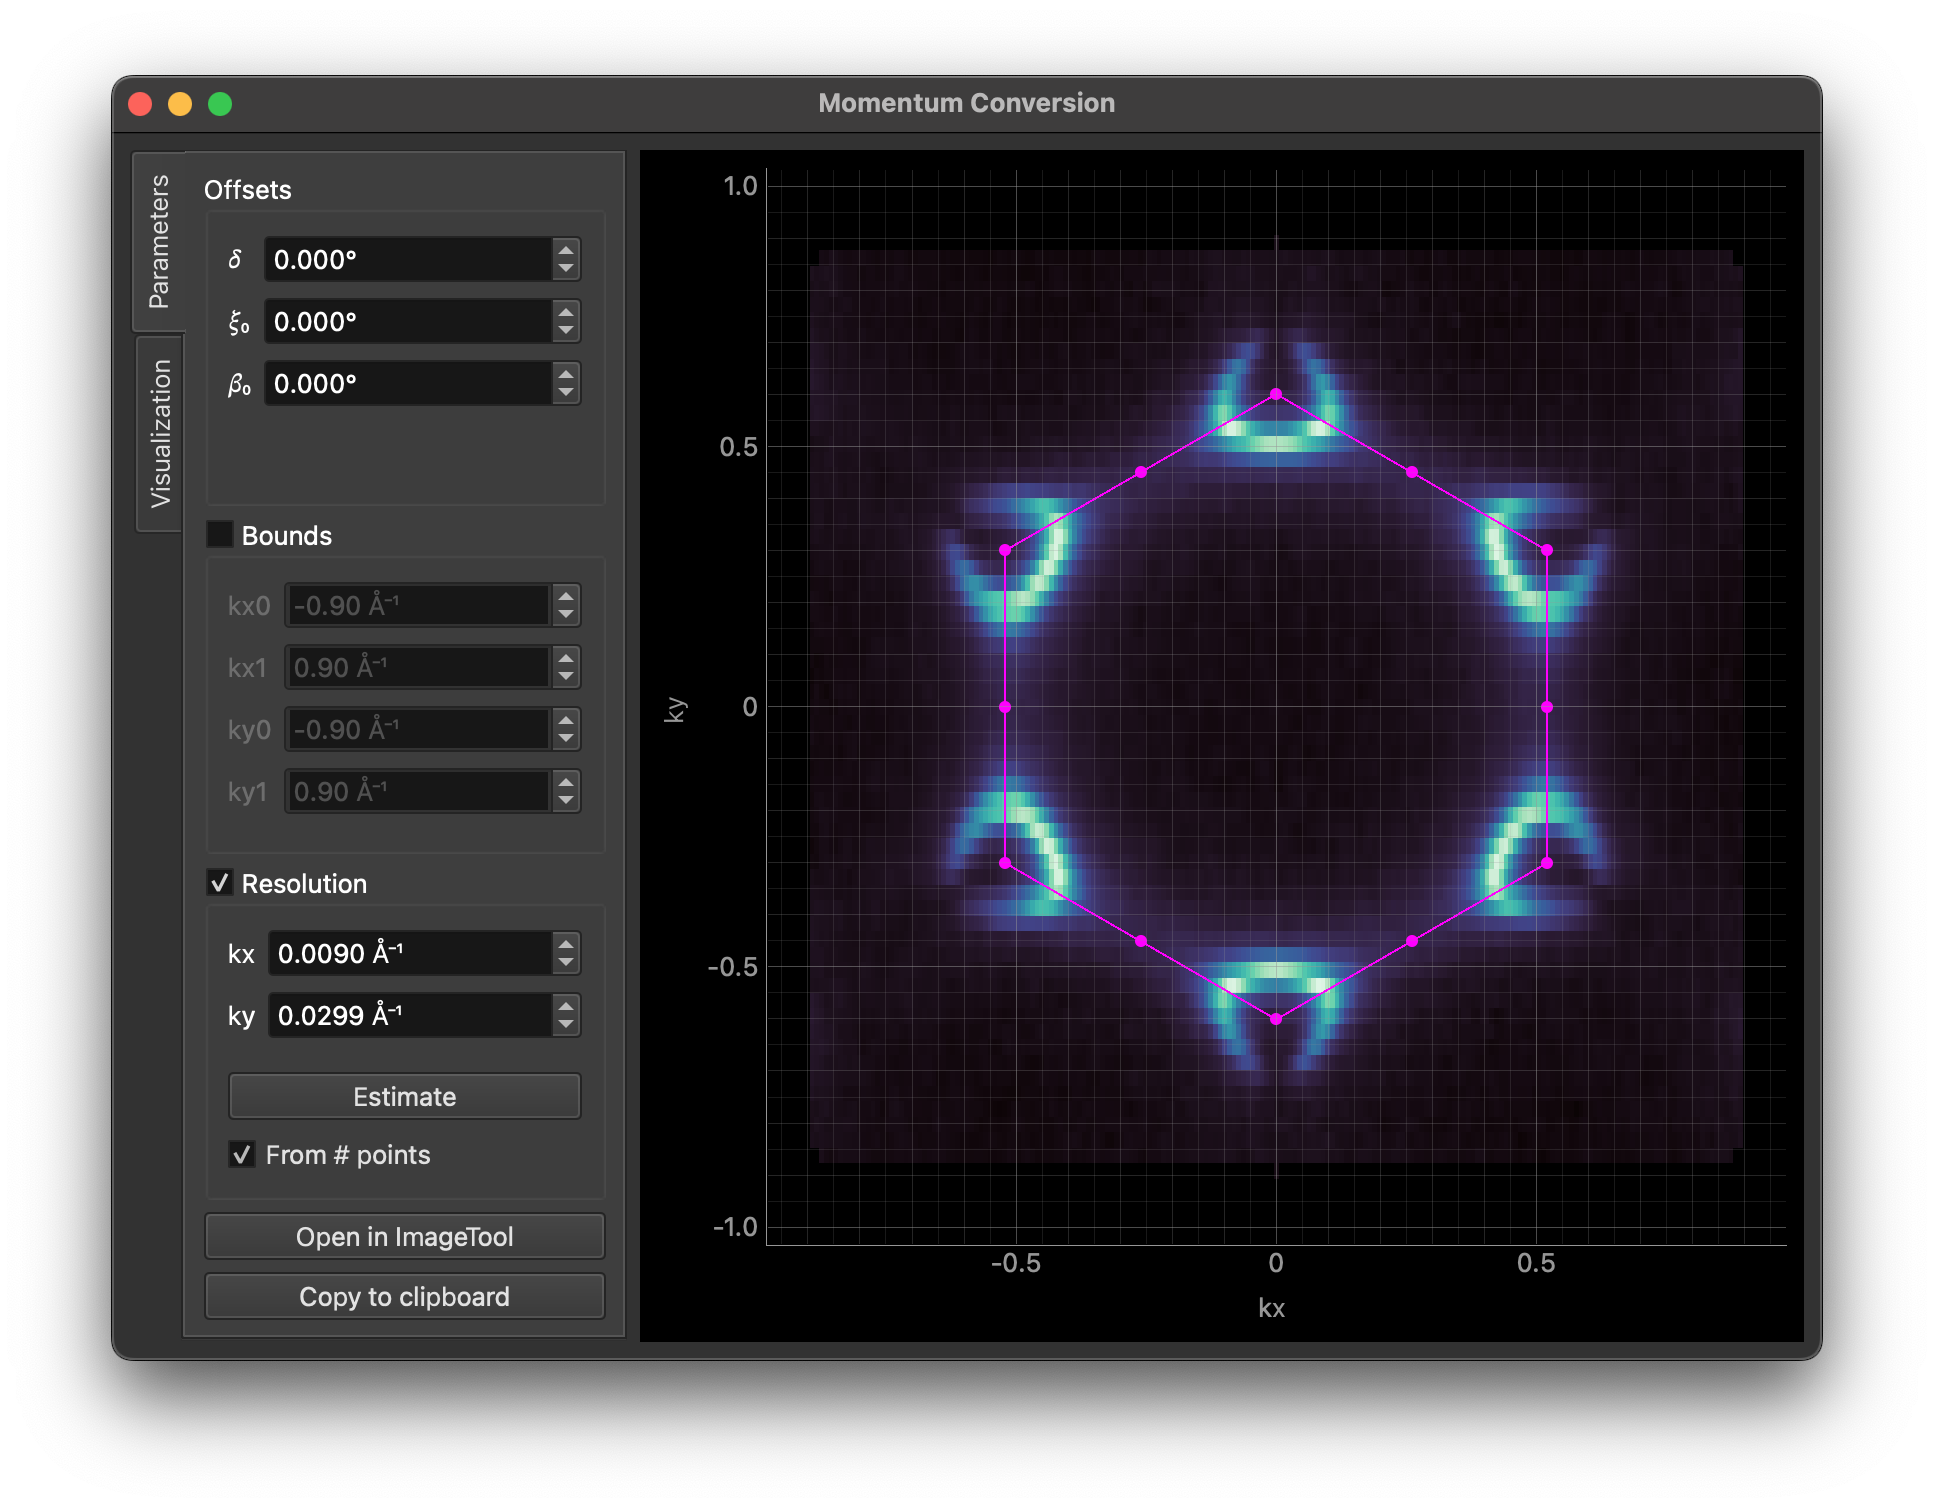
The first tab is for setting the experimental geometry and momentum conversion
parameters. The image is updated in real time as you change the parameters. For
angle-energy cuts, the preview keeps the full energy axis and displays the converted
k/eV cut.
Clicking Copy to clipboard will copy the code for conversion to the clipboard, including any selected configuration change and momentum-conversion settings.
Open in ImageTool performs a full conversion. When ktool was opened from
an ImageTool in the manager, the converted data opens as a child row under ktool;
outside the manager, it opens as a normal standalone ImageTool window.
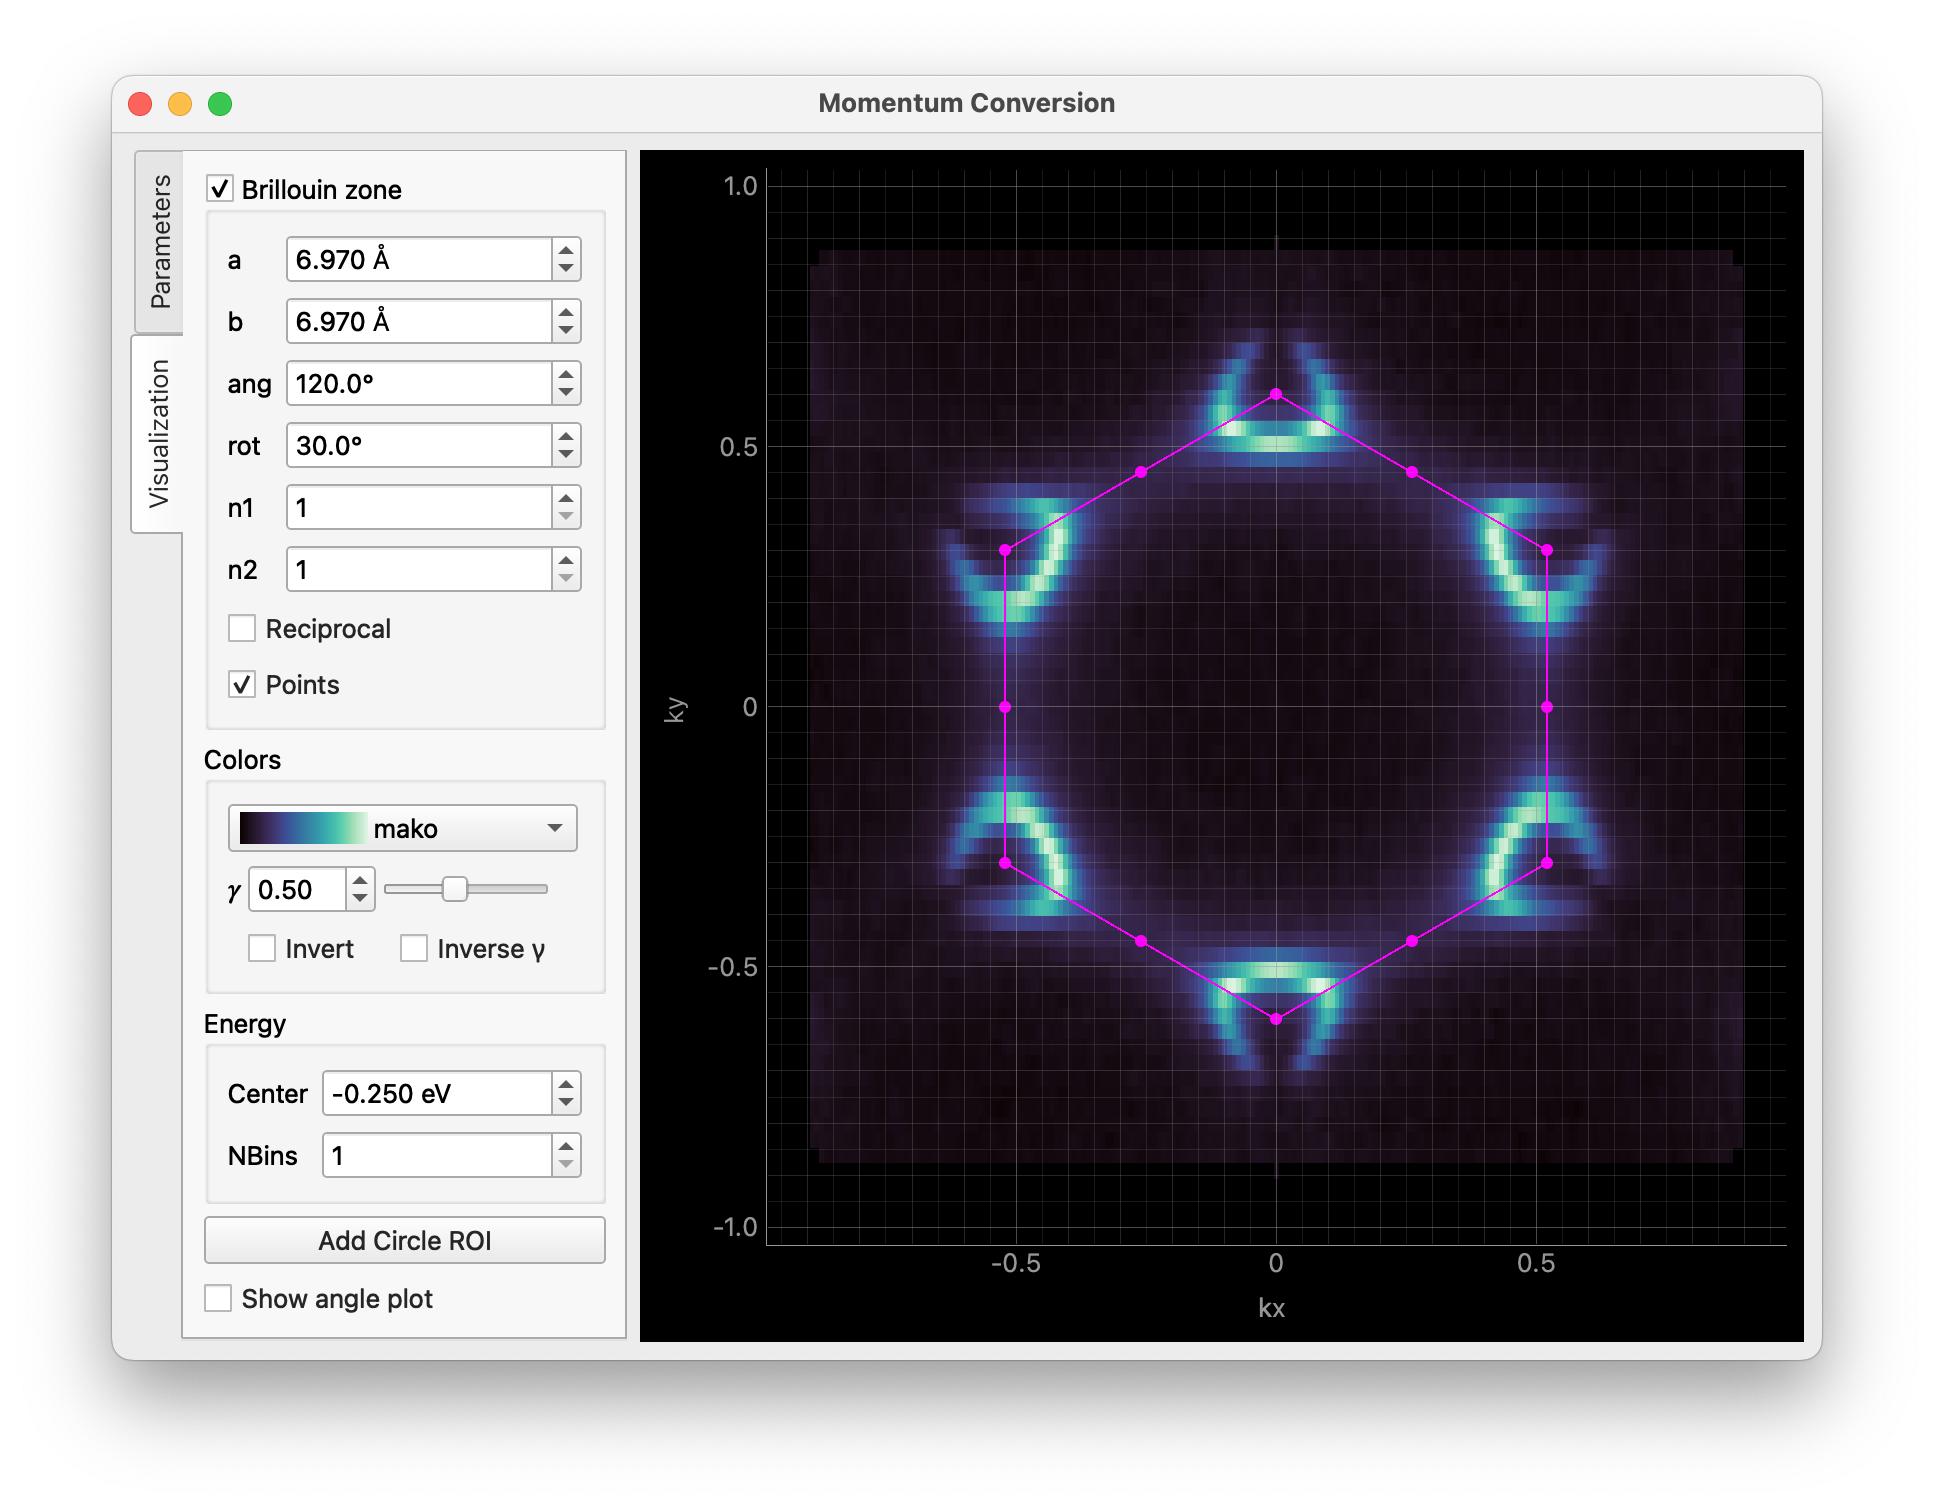
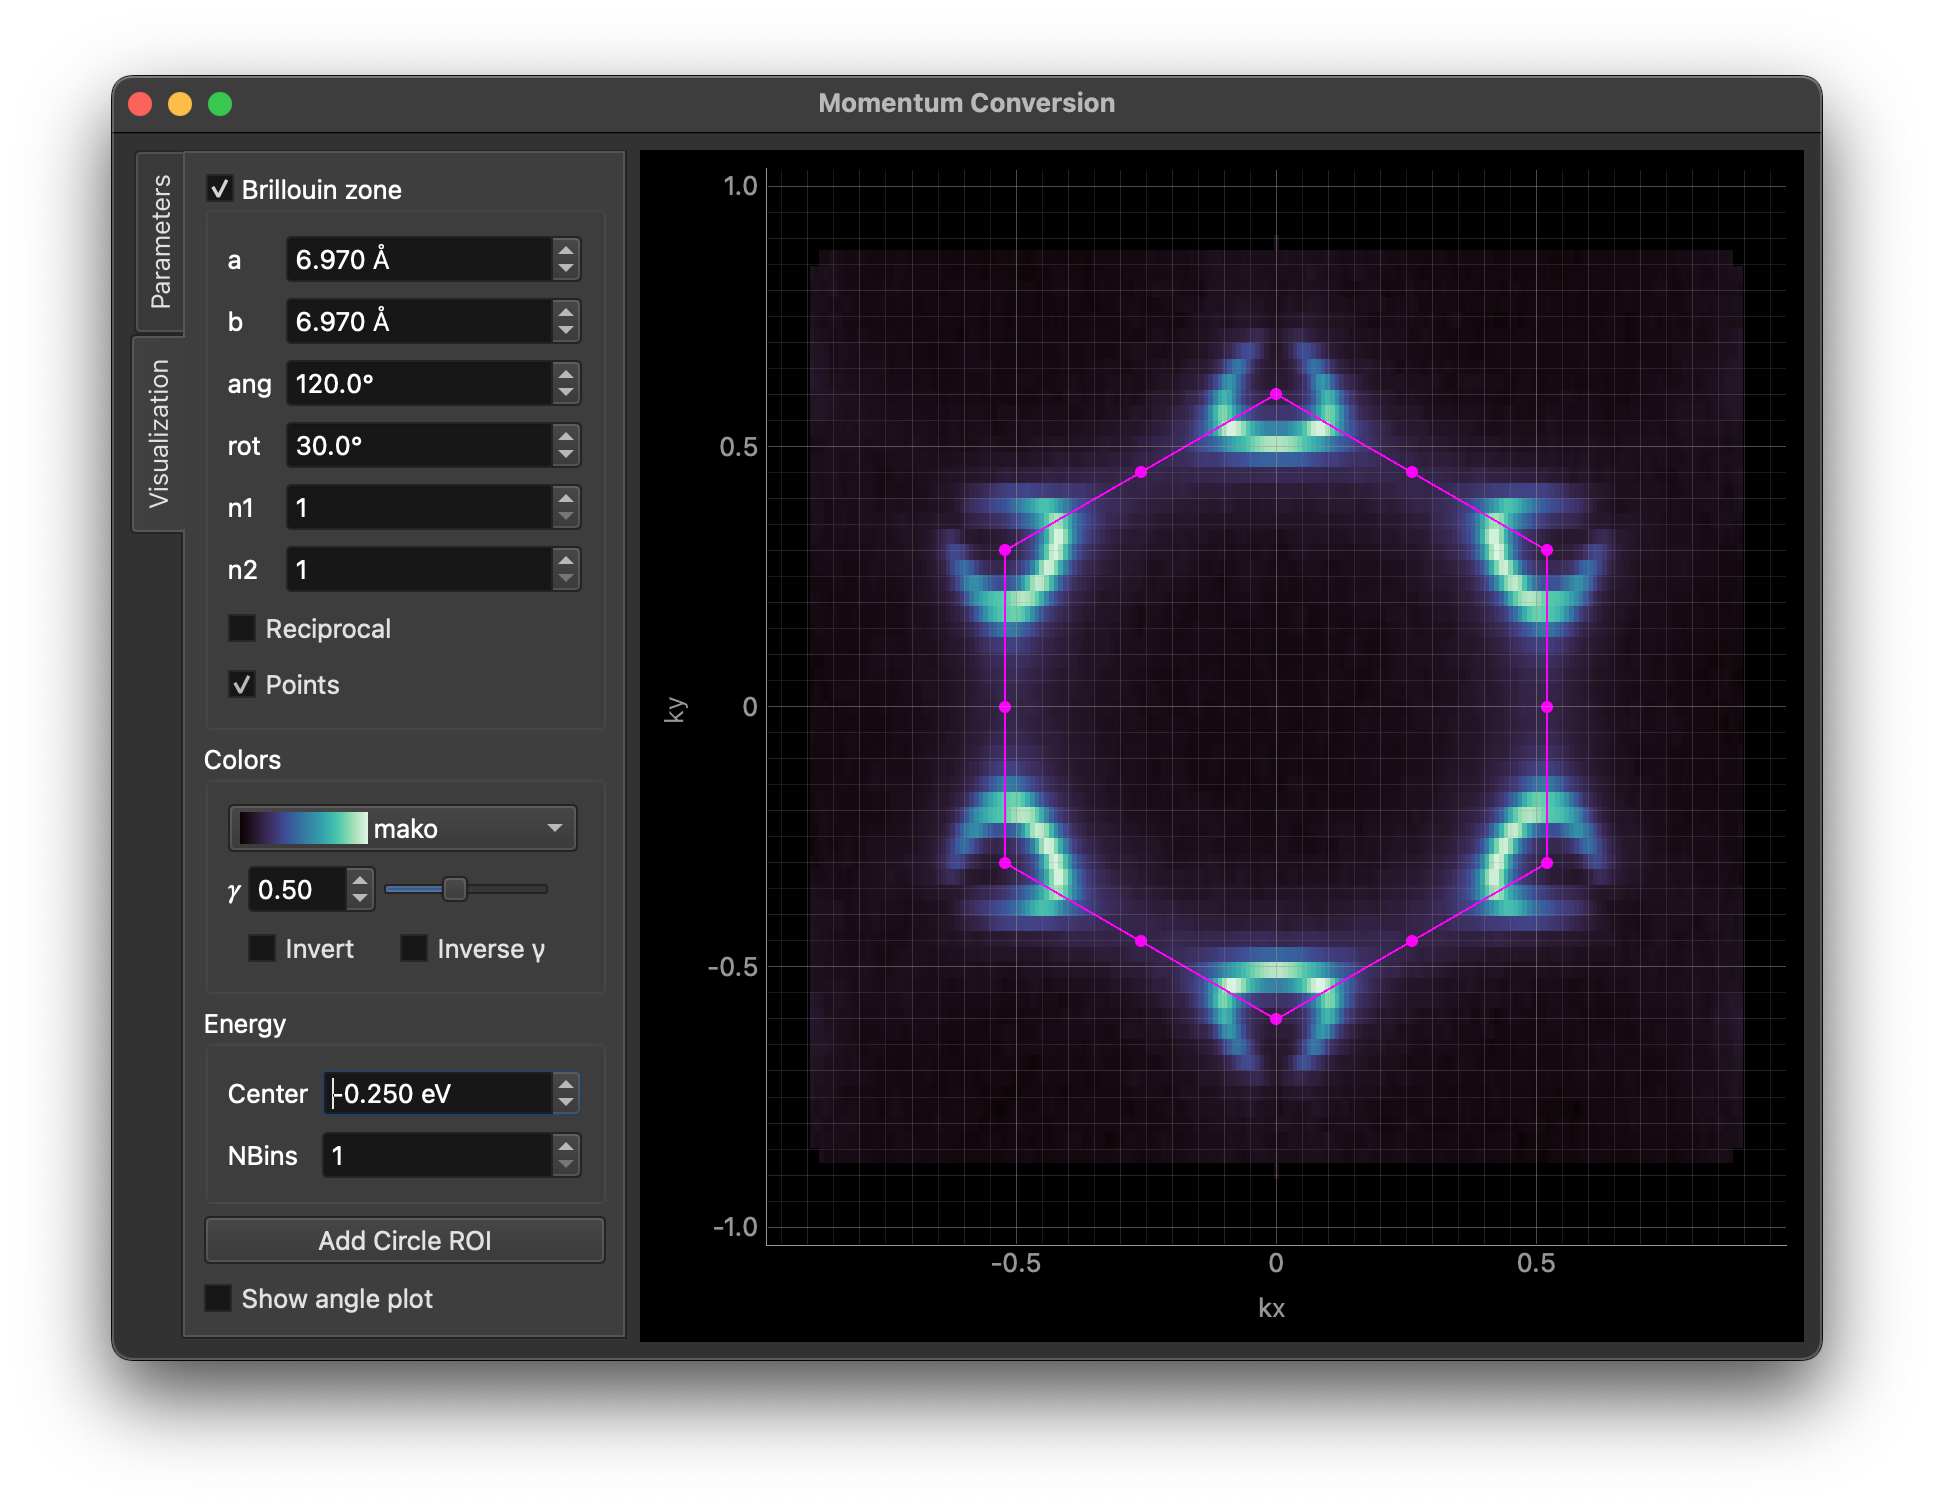
The second tab provides visualization options. You can overlay Brillouin zones and
high symmetry points on momentum-momentum or momentum-kz previews, adjust colors,
and optionally preview n-fold symmetrized constant energy contours for maps.
Brillouin-zone and symmetry previews are disabled for angle-energy cuts.
Note
The symmetrization preview uses the same rotational averaging as
erlab.analysis.transform.symmetrize_nfold(), but it only affects the displayed
image in ktool. Open in ImageTool and Copy to clipboard still use
the unsymmetrized momentum-converted data.
The Add Circle ROI button allows you to add a circular region of interest to the image, which can be edited by dragging or right-clicking on it.
You can pass some parameters to customize the GUI. For example, you can set the Brillouin zone size/orientation and the colormap like this:
data.kspace.interactive(
    avec=np.array([[-3.485, 6.03], [6.97, 0.0]]), rotate_bz=30.0, cmap="viridis"
)
For all available parameters, see the documentation for erlab.interactive.ktool().