Other interactive tools
In addition to ImageTool and the ImageTool manager, other interactive tools for specific tasks are available in the erlab.interactive module.
Most of these tools can be opened as auxiliary windows from within ImageTool, and are also integrated into the ImageTool manager, allowing you to manage them alongside your ImageTool windows.
More interactive tools will be added in the near future. Current plans include:
Curve fitting
Fourier-based automatic mesh removal
Experiment planner
Here are some of the miscellaneous interactive tools provided:
ktool
Interactive conversion from angles to momentum space.
There are four ways to invoke the GUI.
xarray.DataArray.kspace.interactive()data.kspace.interactive()
-
This option is recommended because the name of the input data will be automatically detected and applied to the generated code that is copied to the clipboard.
import erlab.interactive as eri

eri.ktool(data)
From within ImageTool
Click View → Open in ktool.
The button will be disabled if the data is not compatible with
ktool.From IPython using the
%ktoolmagic described in Notebook shortcuts.
The GUI is divided into two tabs.
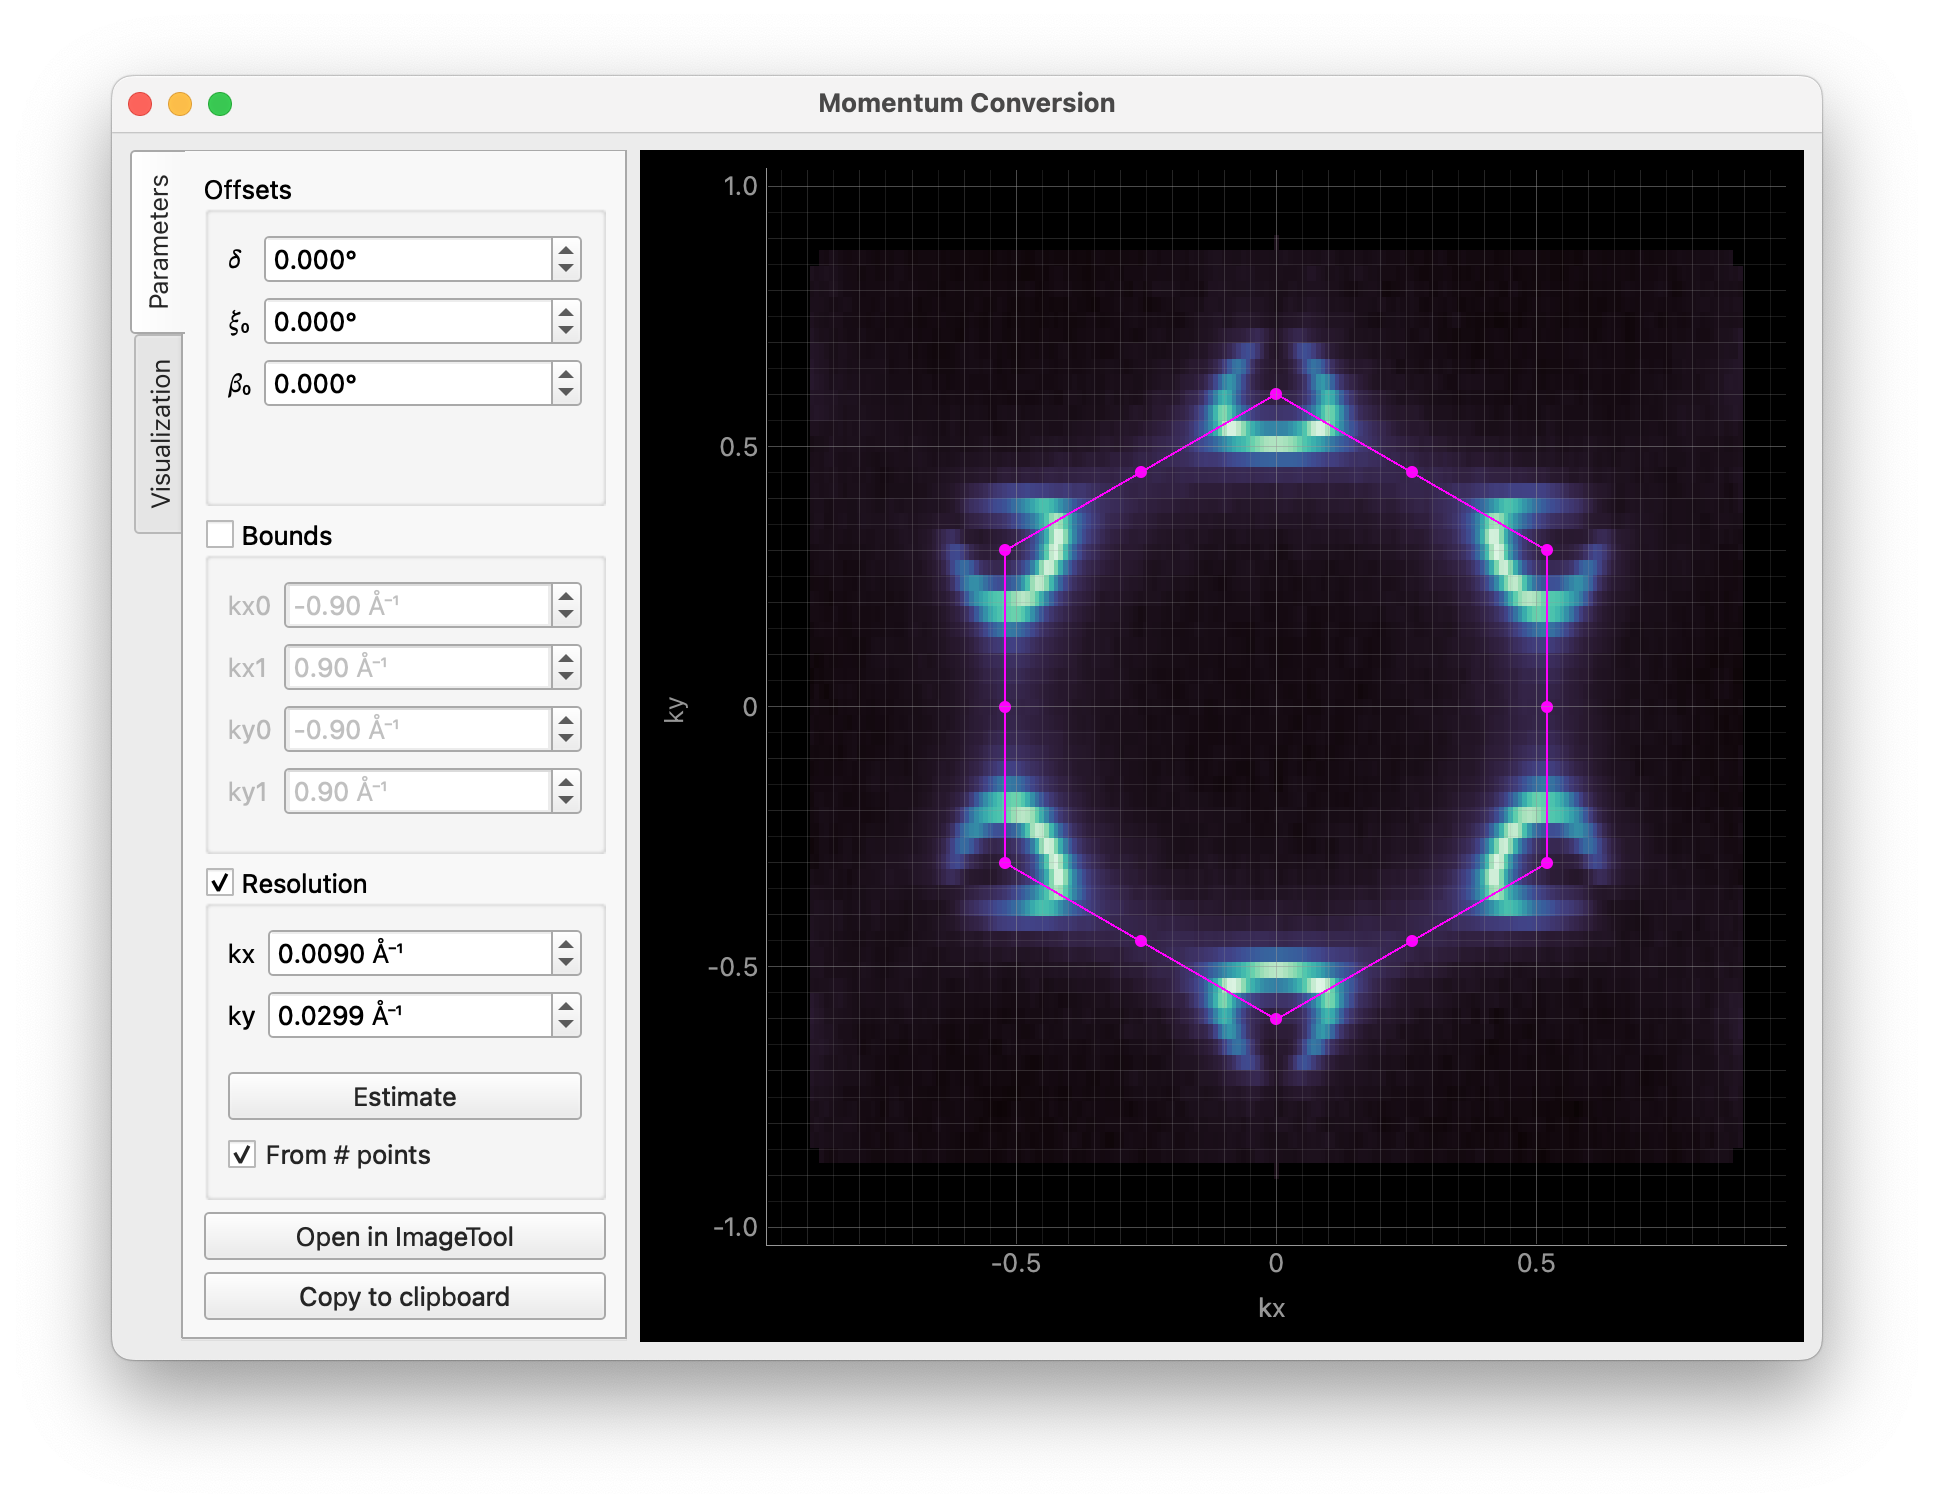
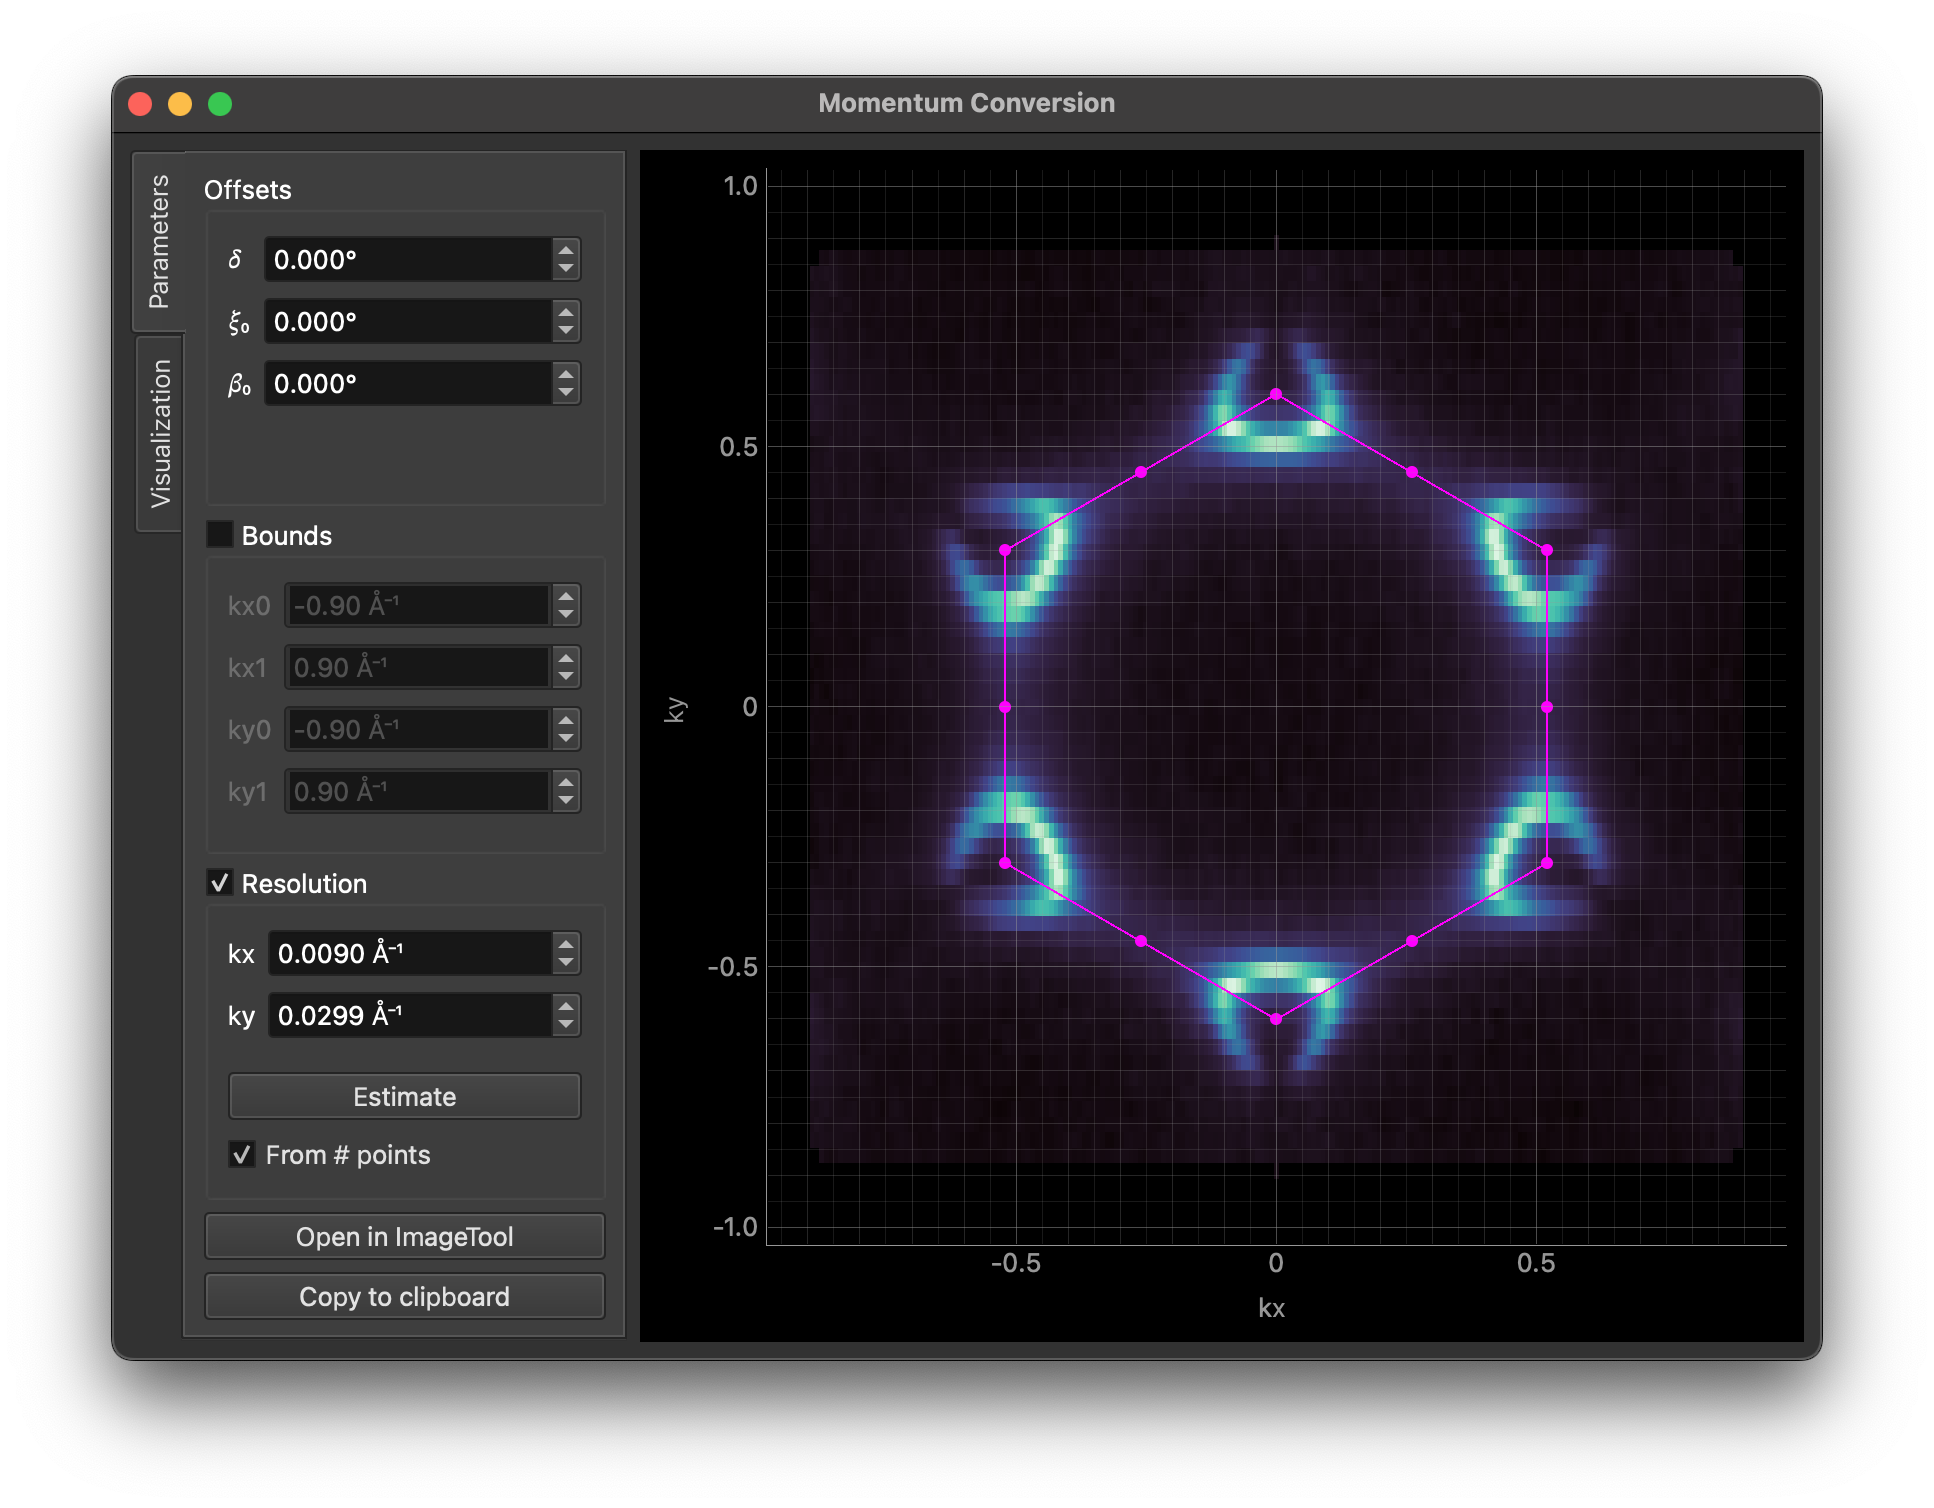
The first tab is for setting momentum conversion parameters. The image is updated in real time as you change the parameters.
Clicking Copy code will copy the code for conversion to the clipboard.
Open in ImageTool performs a full conversion and opens the result in a new ImageTool.
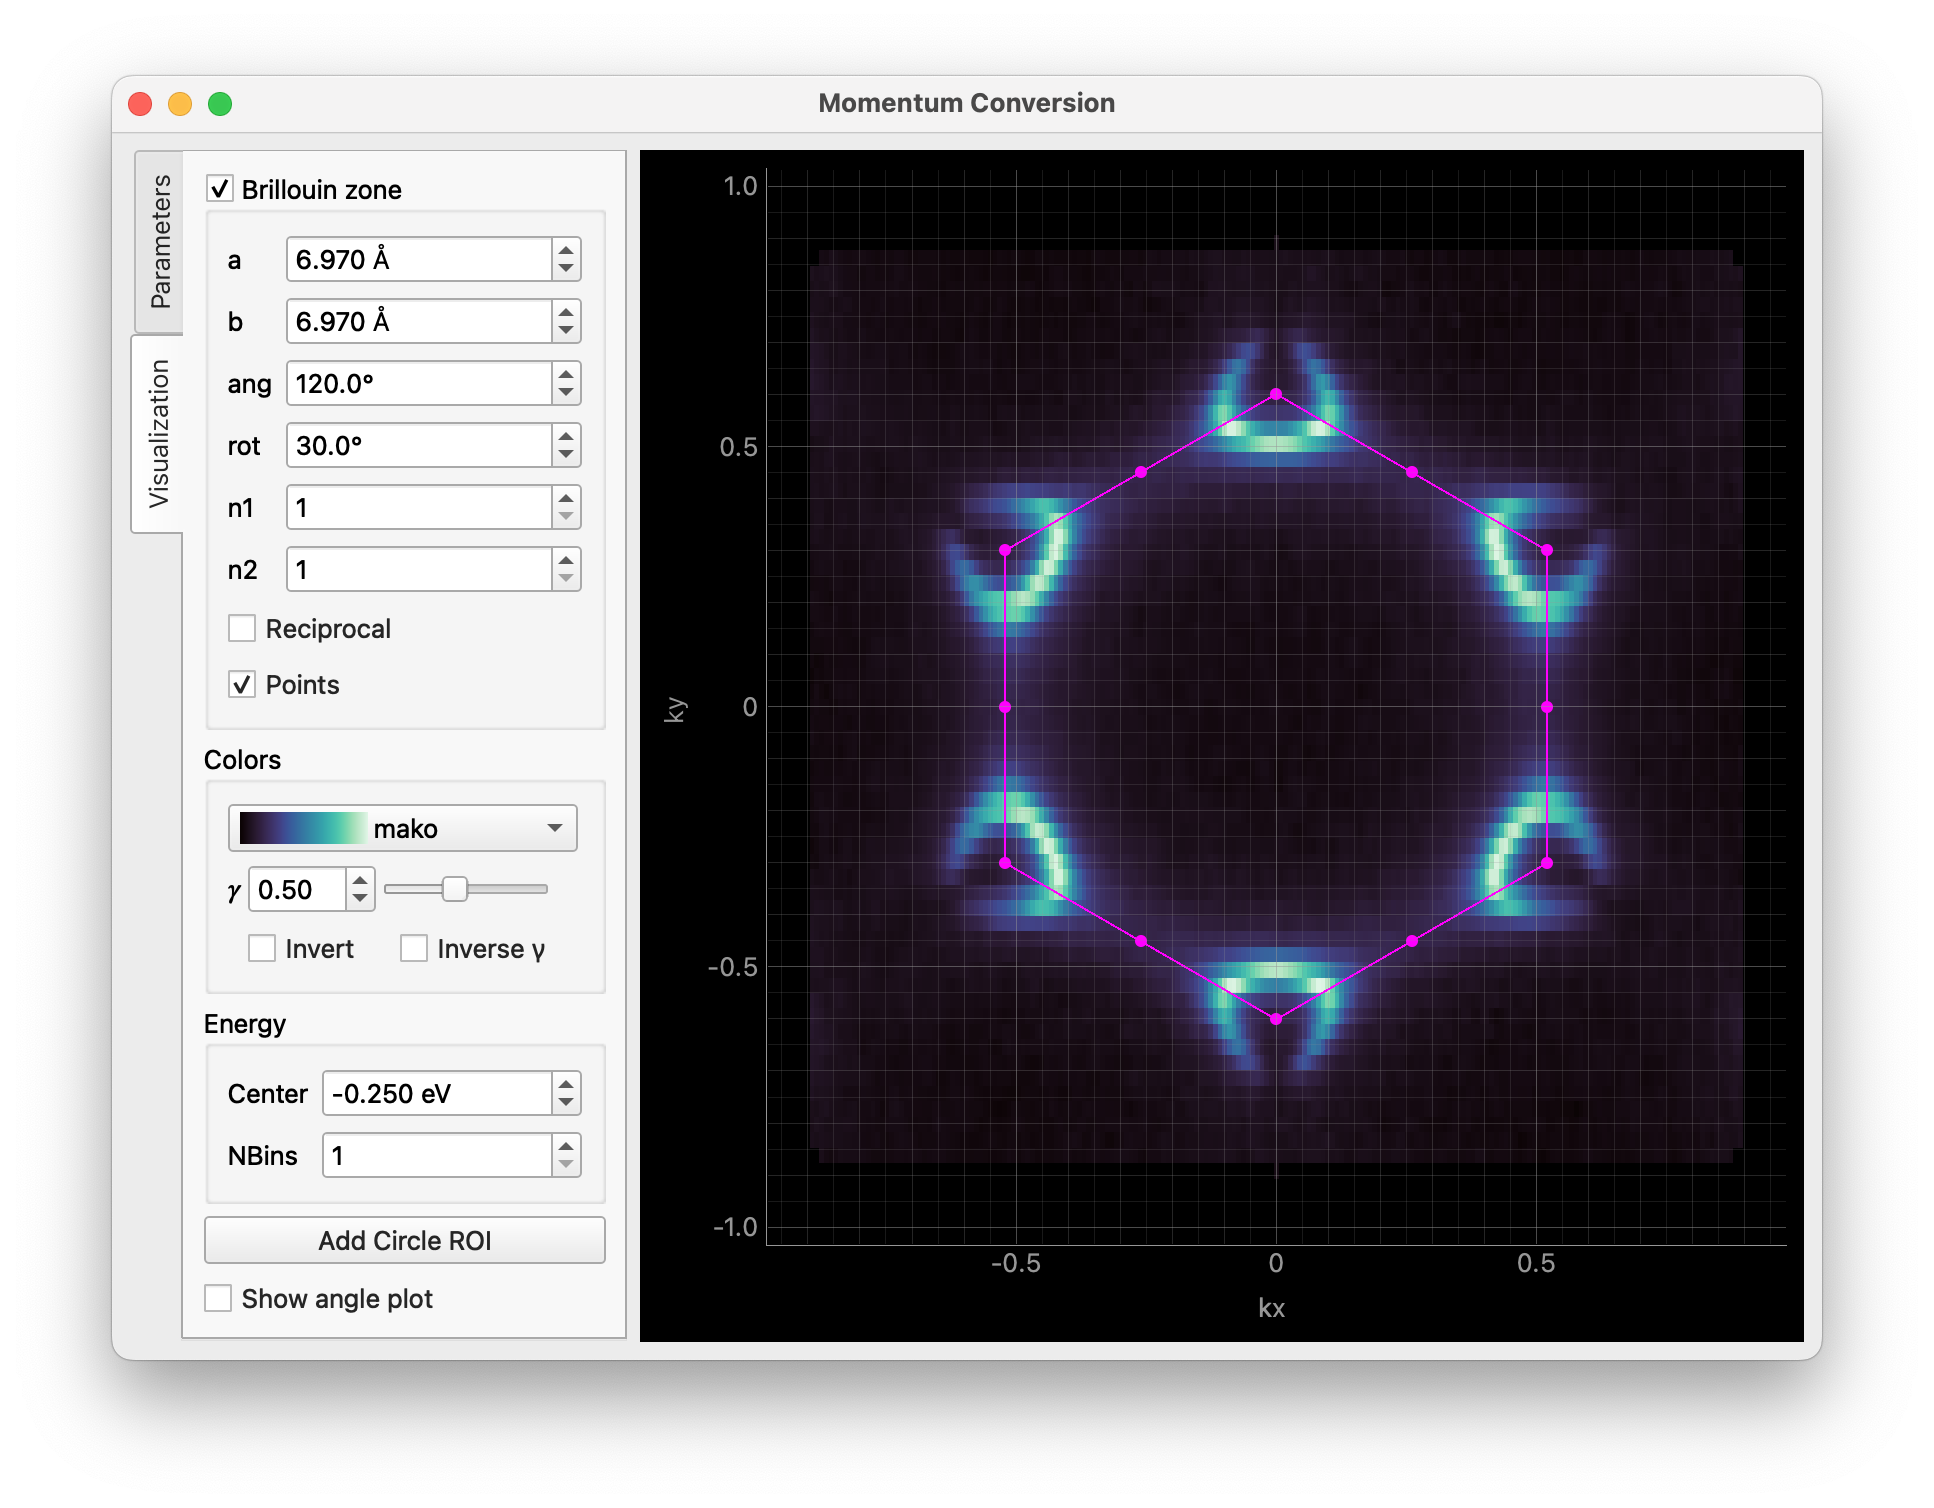
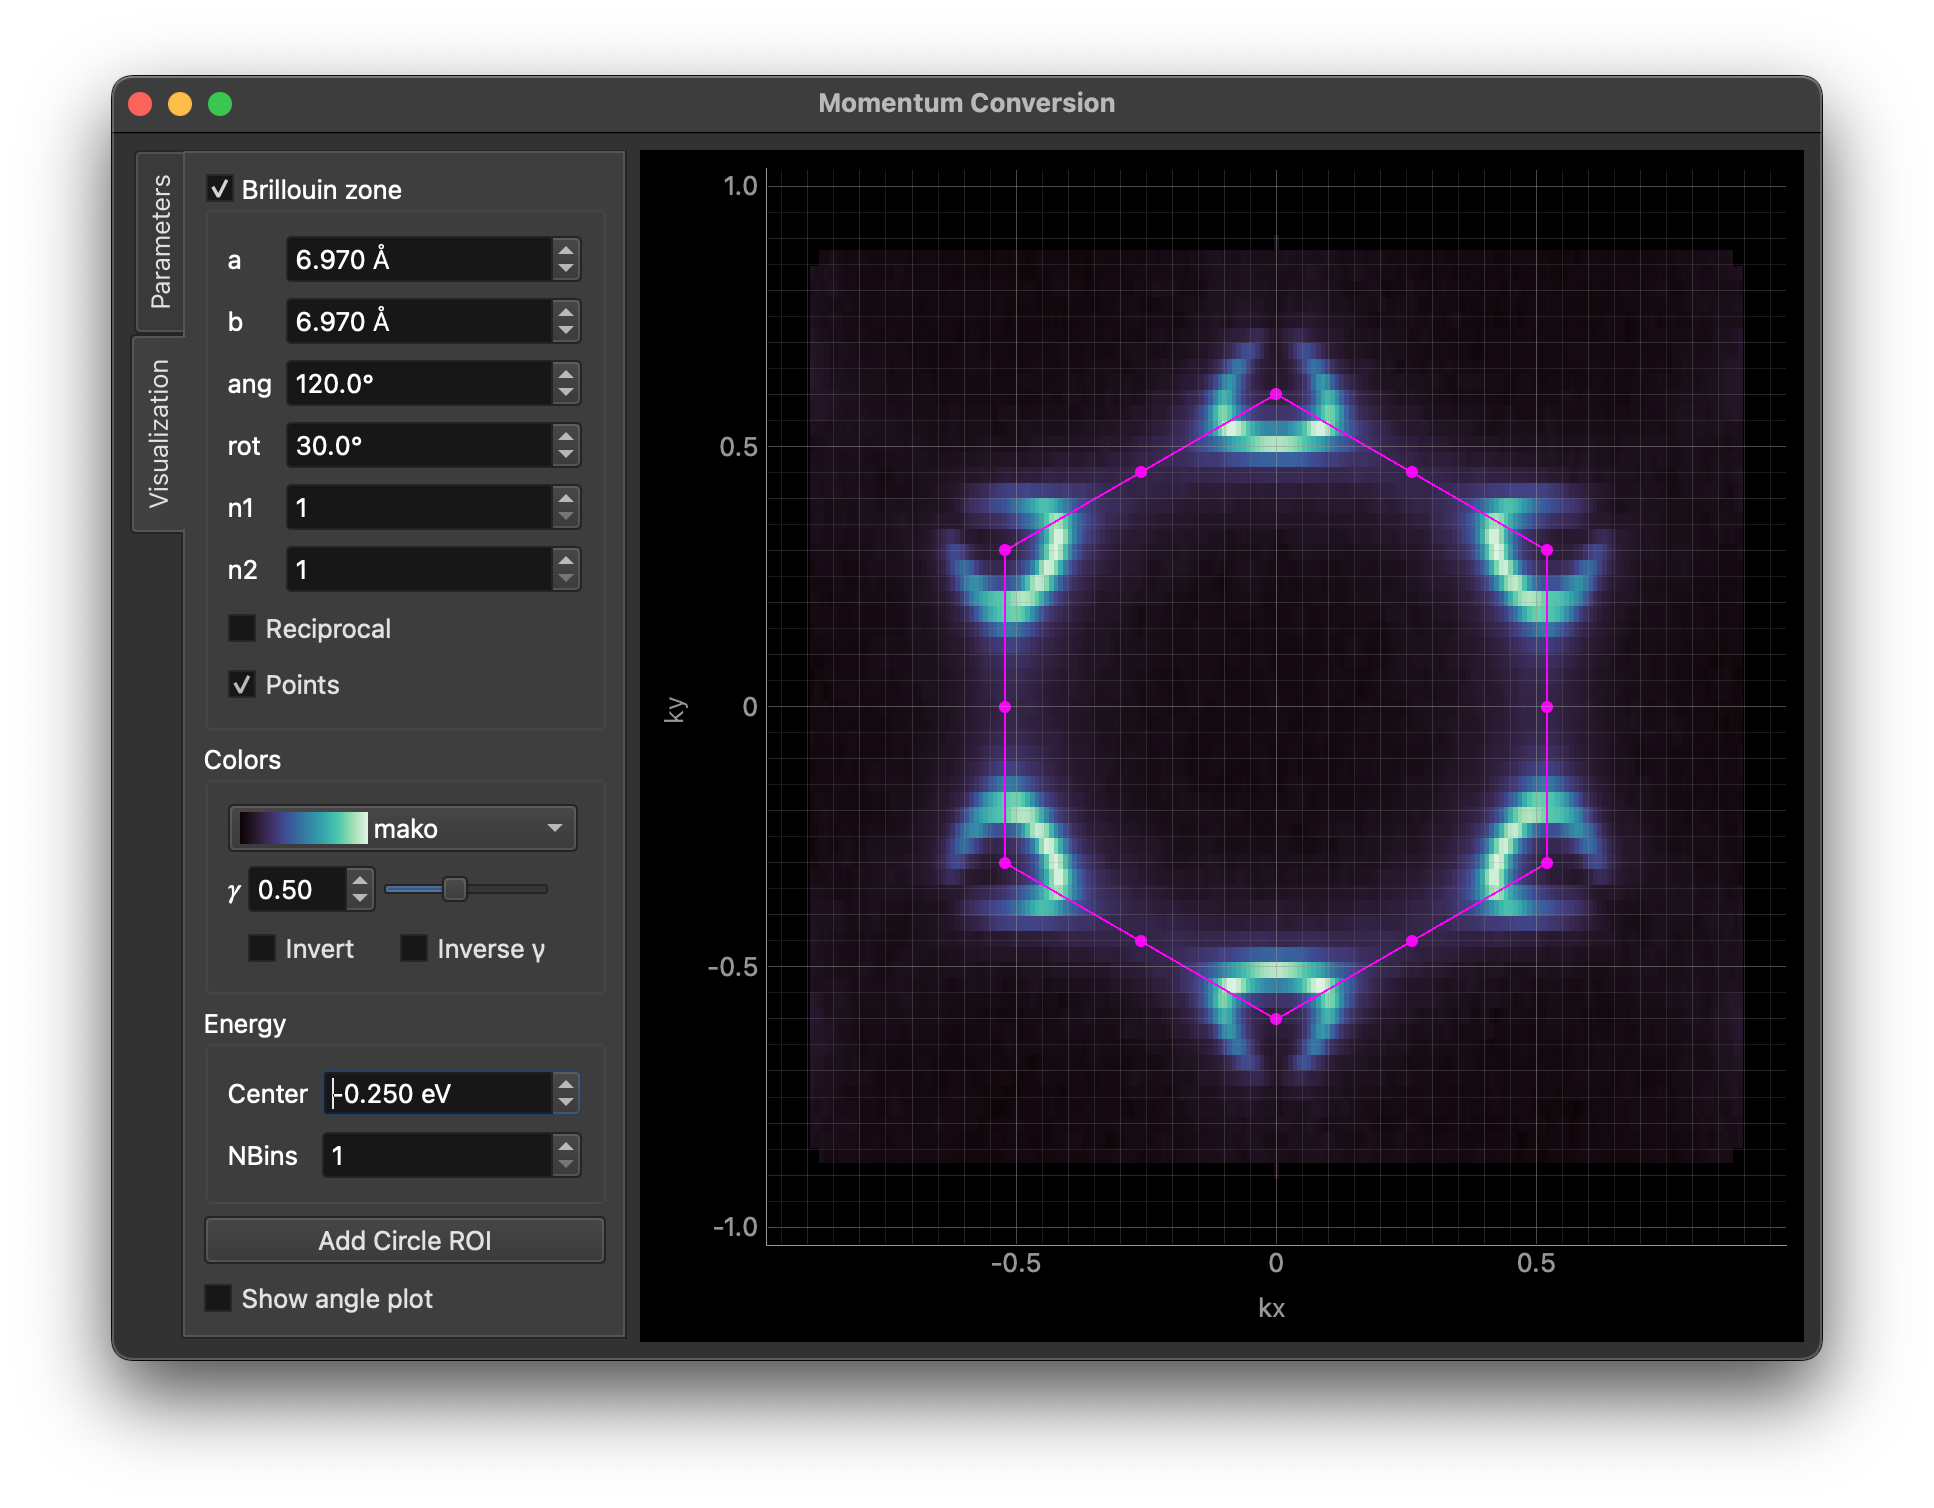
The second tab provides visualization options. You can overlay Brillouin zones and high symmetry points on the result, adjust colors, apply binning, and more.
The Add Circle ROI button allows you to add a circular region of interest to the image, which can be edited by dragging or right-clicking on it.
You can pass some parameters to customize the GUI. For example, you can set the Brillouin zone size/orientation and the colormap like this:
data.kspace.interactive(
    avec=np.array([[-3.485, 6.03], [6.97, 0.0]]), rotate_bz=30.0, cmap="viridis"
)
For all available parameters, see the documentation for erlab.interactive.ktool().
dtool
Interactive tool for visualizing dispersive data using derivative-based methods.
The GUI can be invoked with erlab.interactive.dtool():
import erlab.interactive as eri

eri.dtool(data)
It can also be opened from within ImageTool from the right-click context menu of any image plot.
The %dtool line magic (see Notebook shortcuts) provides the same entry point from notebooks.
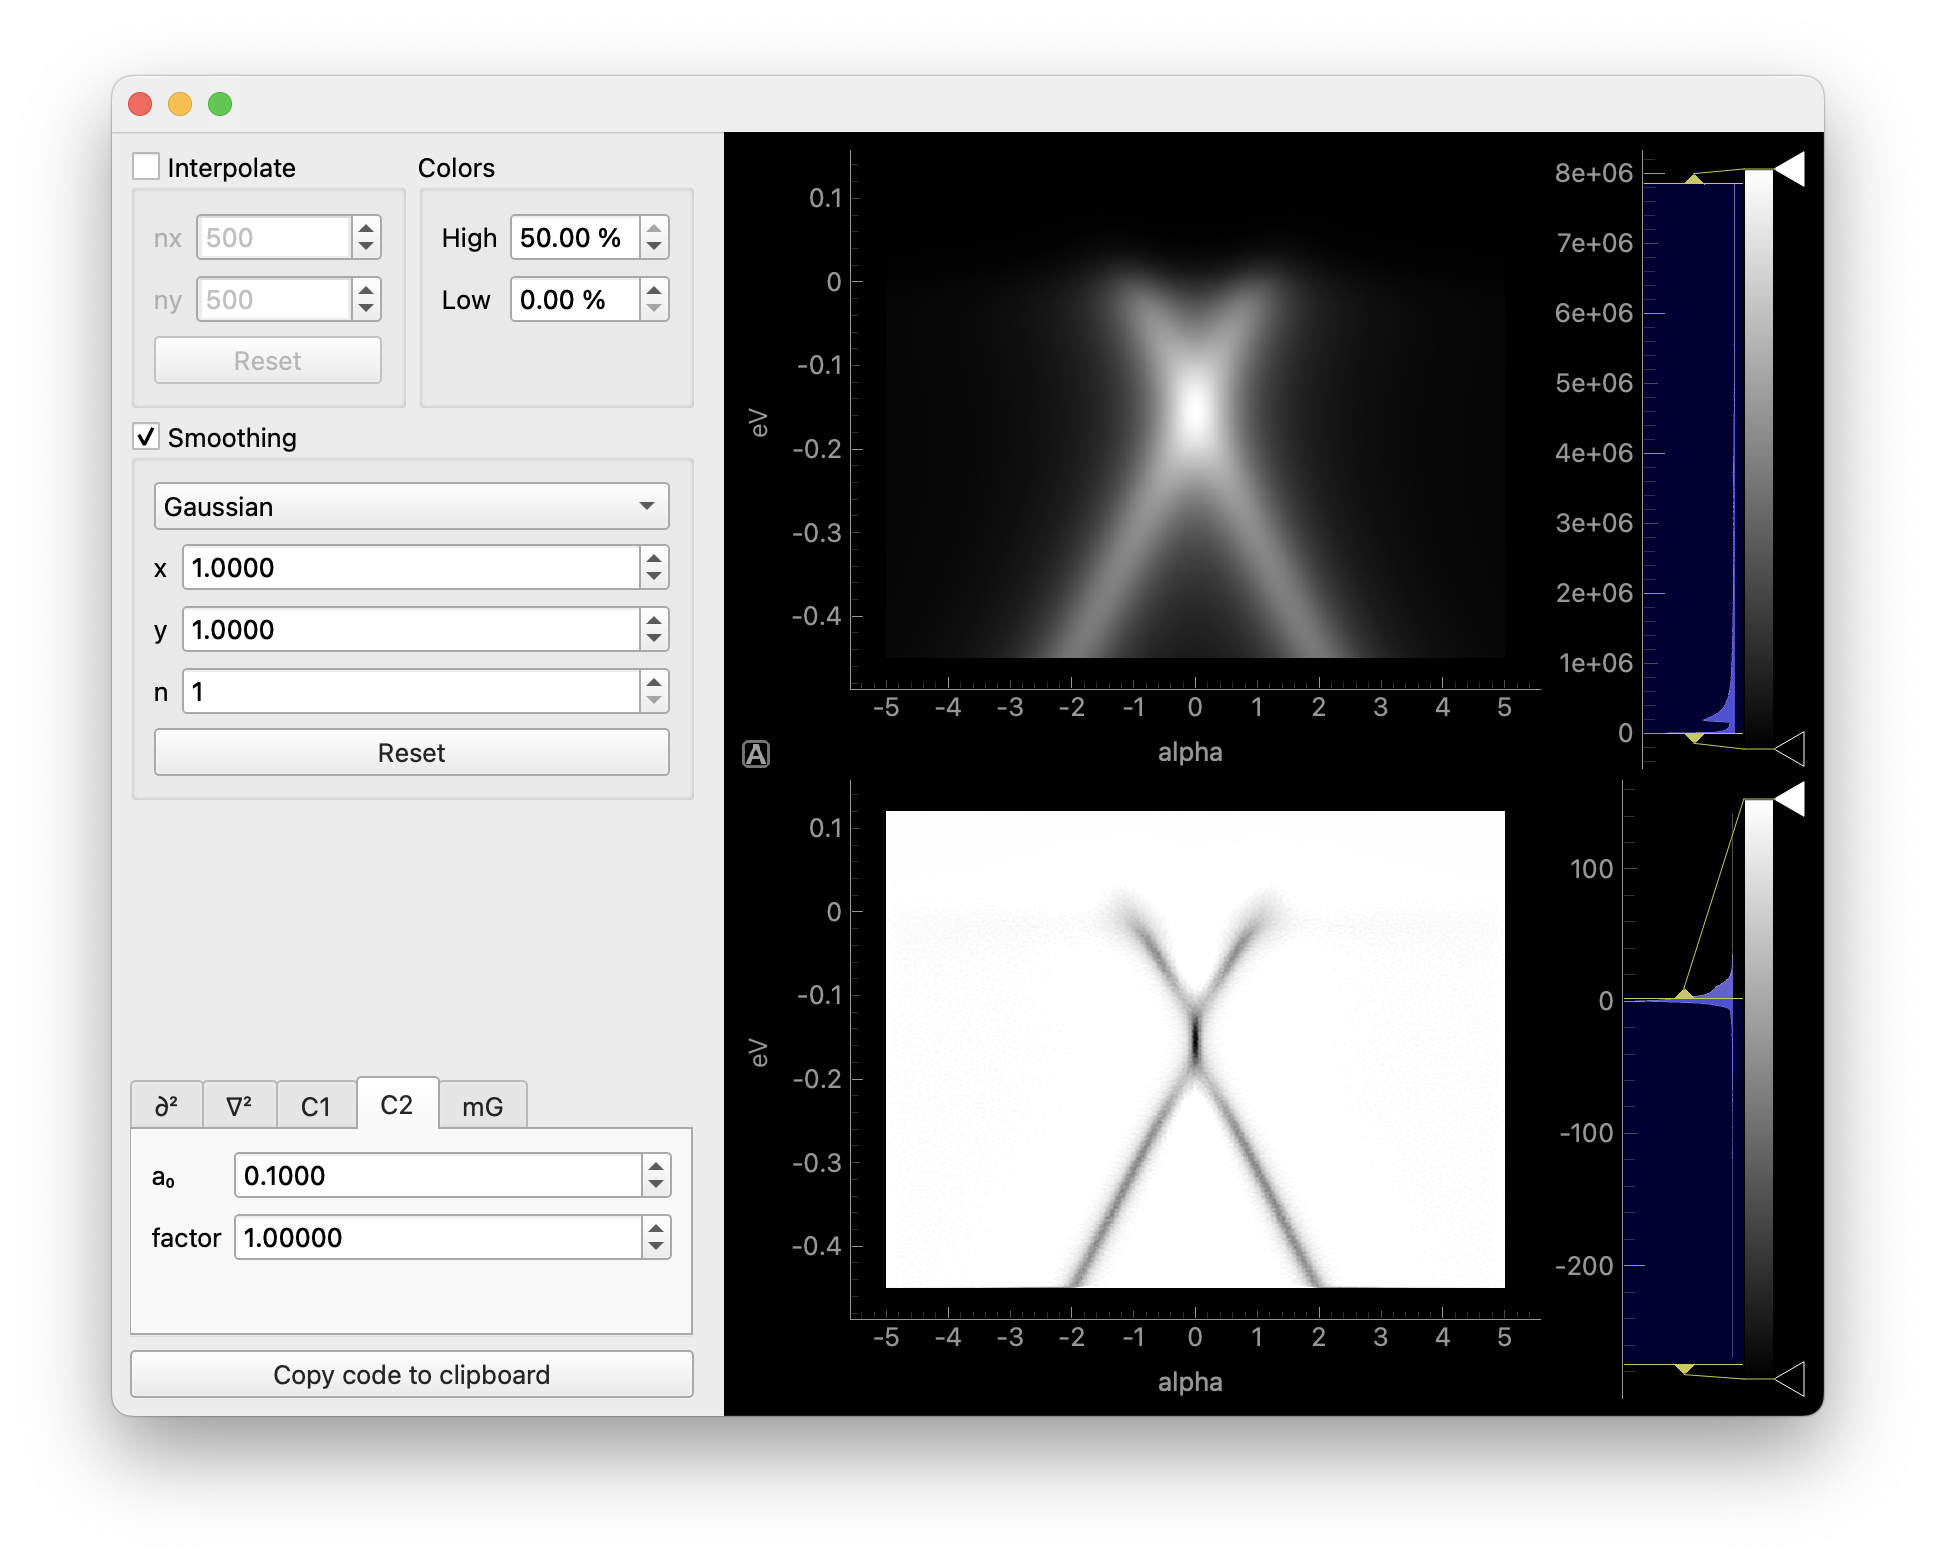
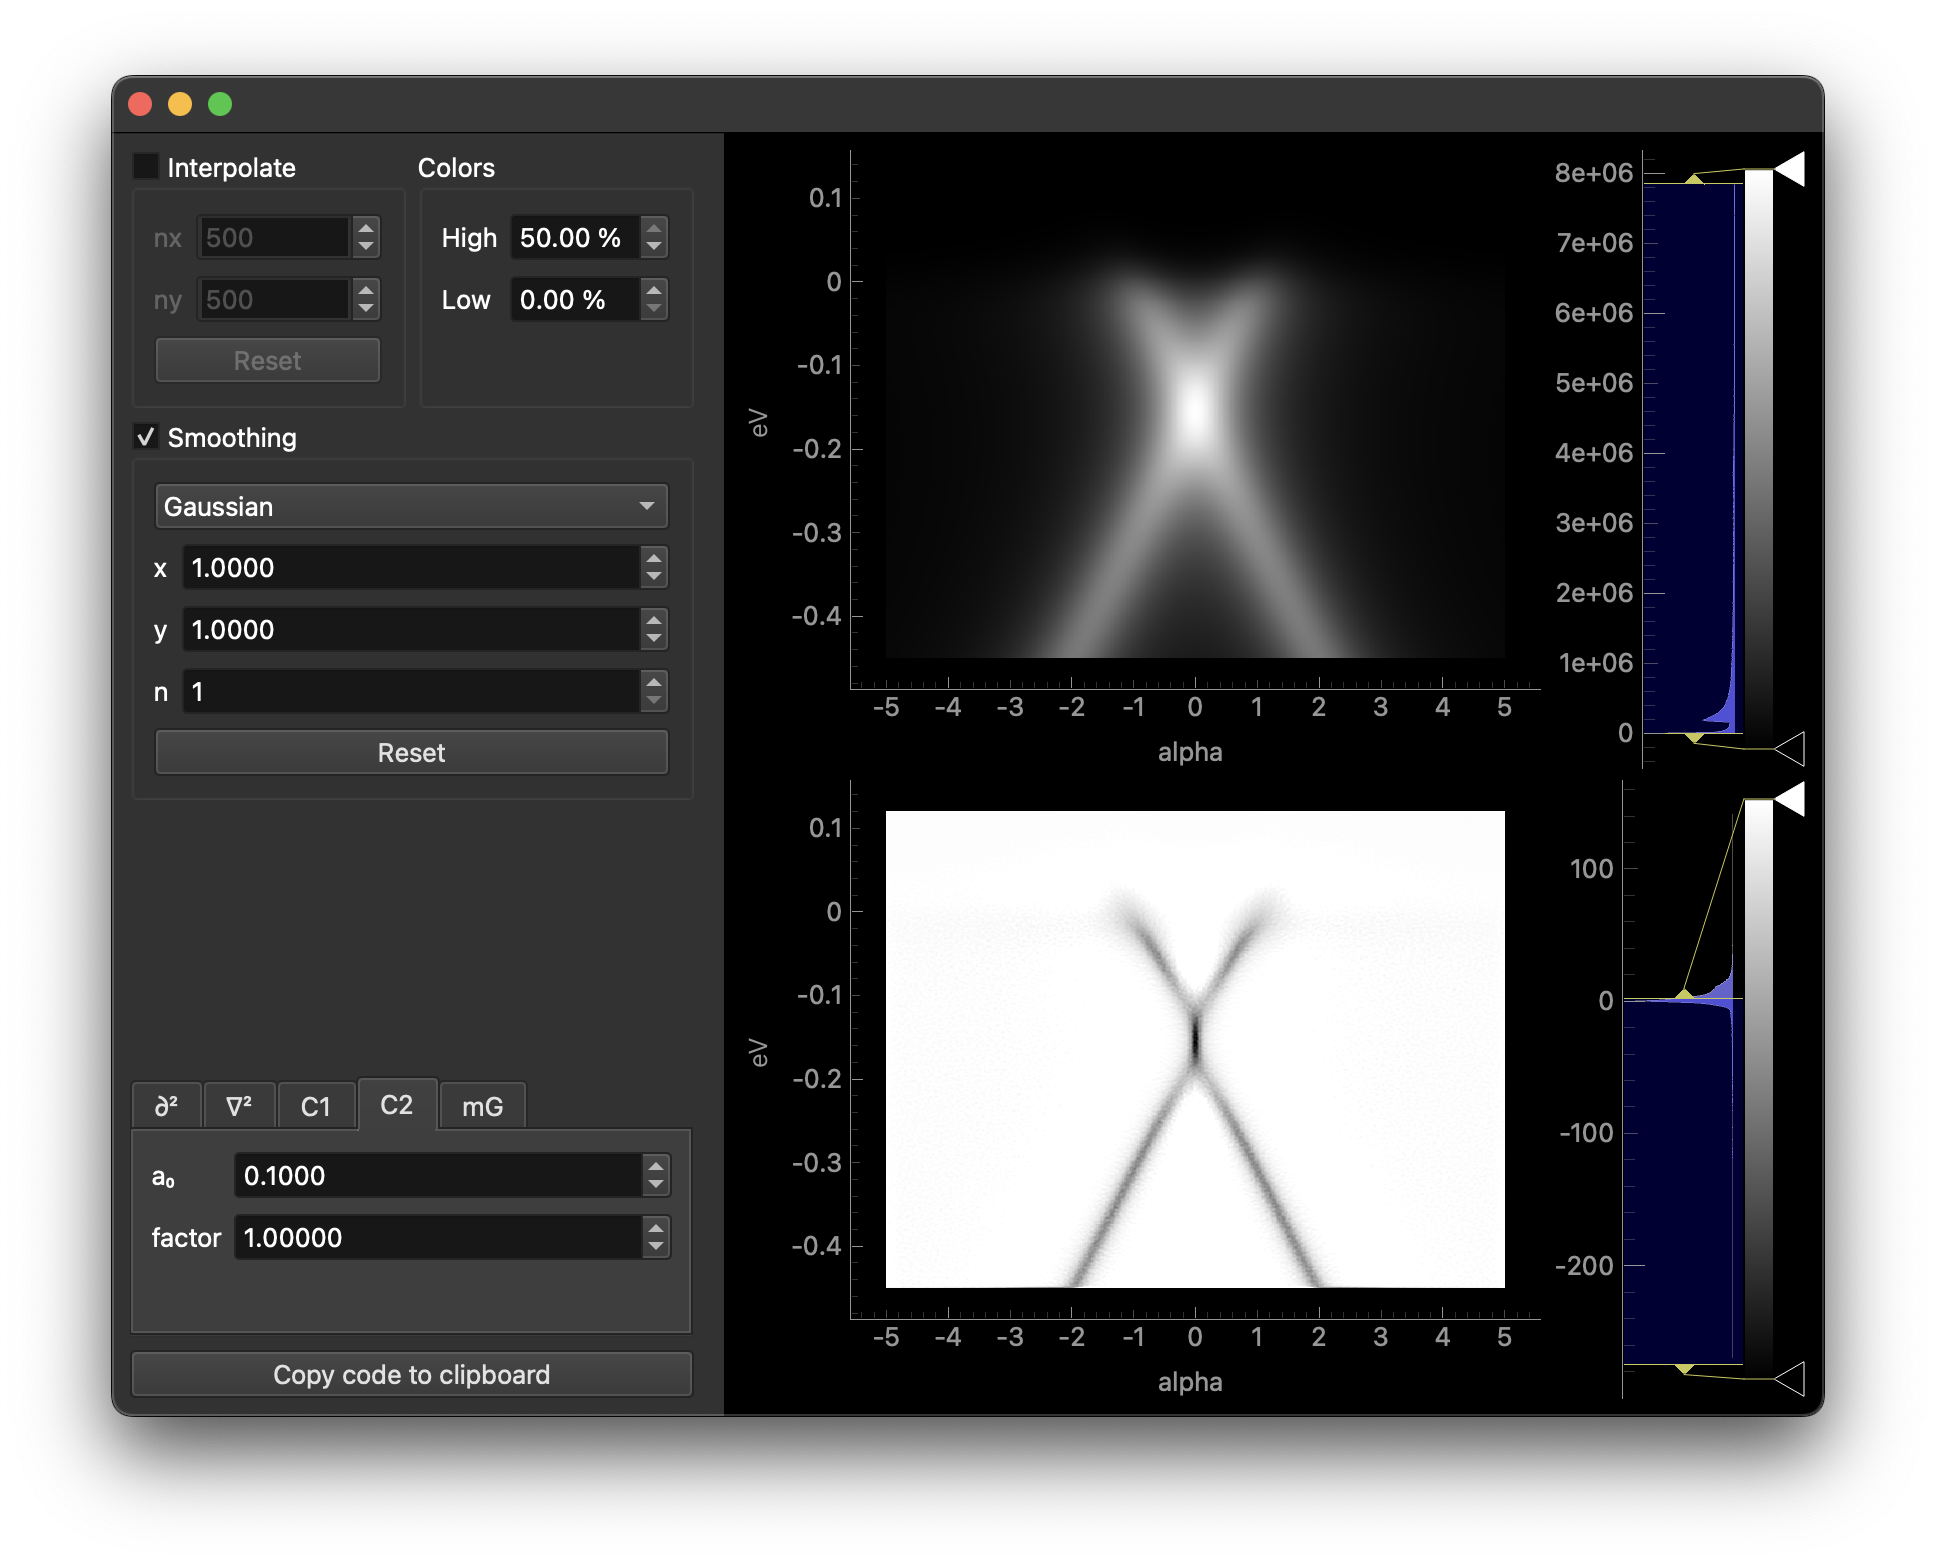
The first section interpolates the data to a grid prior to smoothing.
The second section applies smoothing prior to differentiation.
In the third section, selecting different tabs will apply different methods. Each tab contains parameters relevant to the selected method.
Clicking the copy button will copy the code for differentiation to the clipboard.
Both the smoothed data and the result can be opened in ImageTool from the right-click menu of each plot, where it can be analyzed further or saved to disk.
goldtool
Interactive tool for obtaining the shape of the Fermi edge (e.g., from a gold reference spectrum).
The GUI can be invoked with erlab.interactive.goldtool():
import erlab.interactive as eri

eri.goldtool(data)
It can also be opened from within ImageTool from the right-click context menu of any image plot.
Use the %goldtool magic (see Notebook shortcuts) to launch it directly from IPython.
restool
Interactive tool for fitting a single resolution-broadened Fermi-Dirac distribution to an energy distribution curve (EDC). The momentum range to be integrated over can be adjusted interactively. This is useful for quickly determining the energy resolution of the current experiment.
The GUI can be invoked with erlab.interactive.restool():
import erlab.interactive as eri

eri.restool(data)
It can also be opened from within ImageTool from the right-click context menu of any image plot that contains an energy axis.
The %restool magic (see Notebook shortcuts) provides a quick way to launch it from IPython.
meshtool
Interactive tool for removing grid-like mesh artifacts from fixed mode ARPES data.
The GUI can be invoked with erlab.interactive.meshtool():
import erlab.interactive as eri

eri.meshtool(data)
It can also be opened from within ImageTool by clicking View → Open in meshtool.
The %meshtool magic (see Notebook shortcuts) provides a quick way to launch it from IPython.
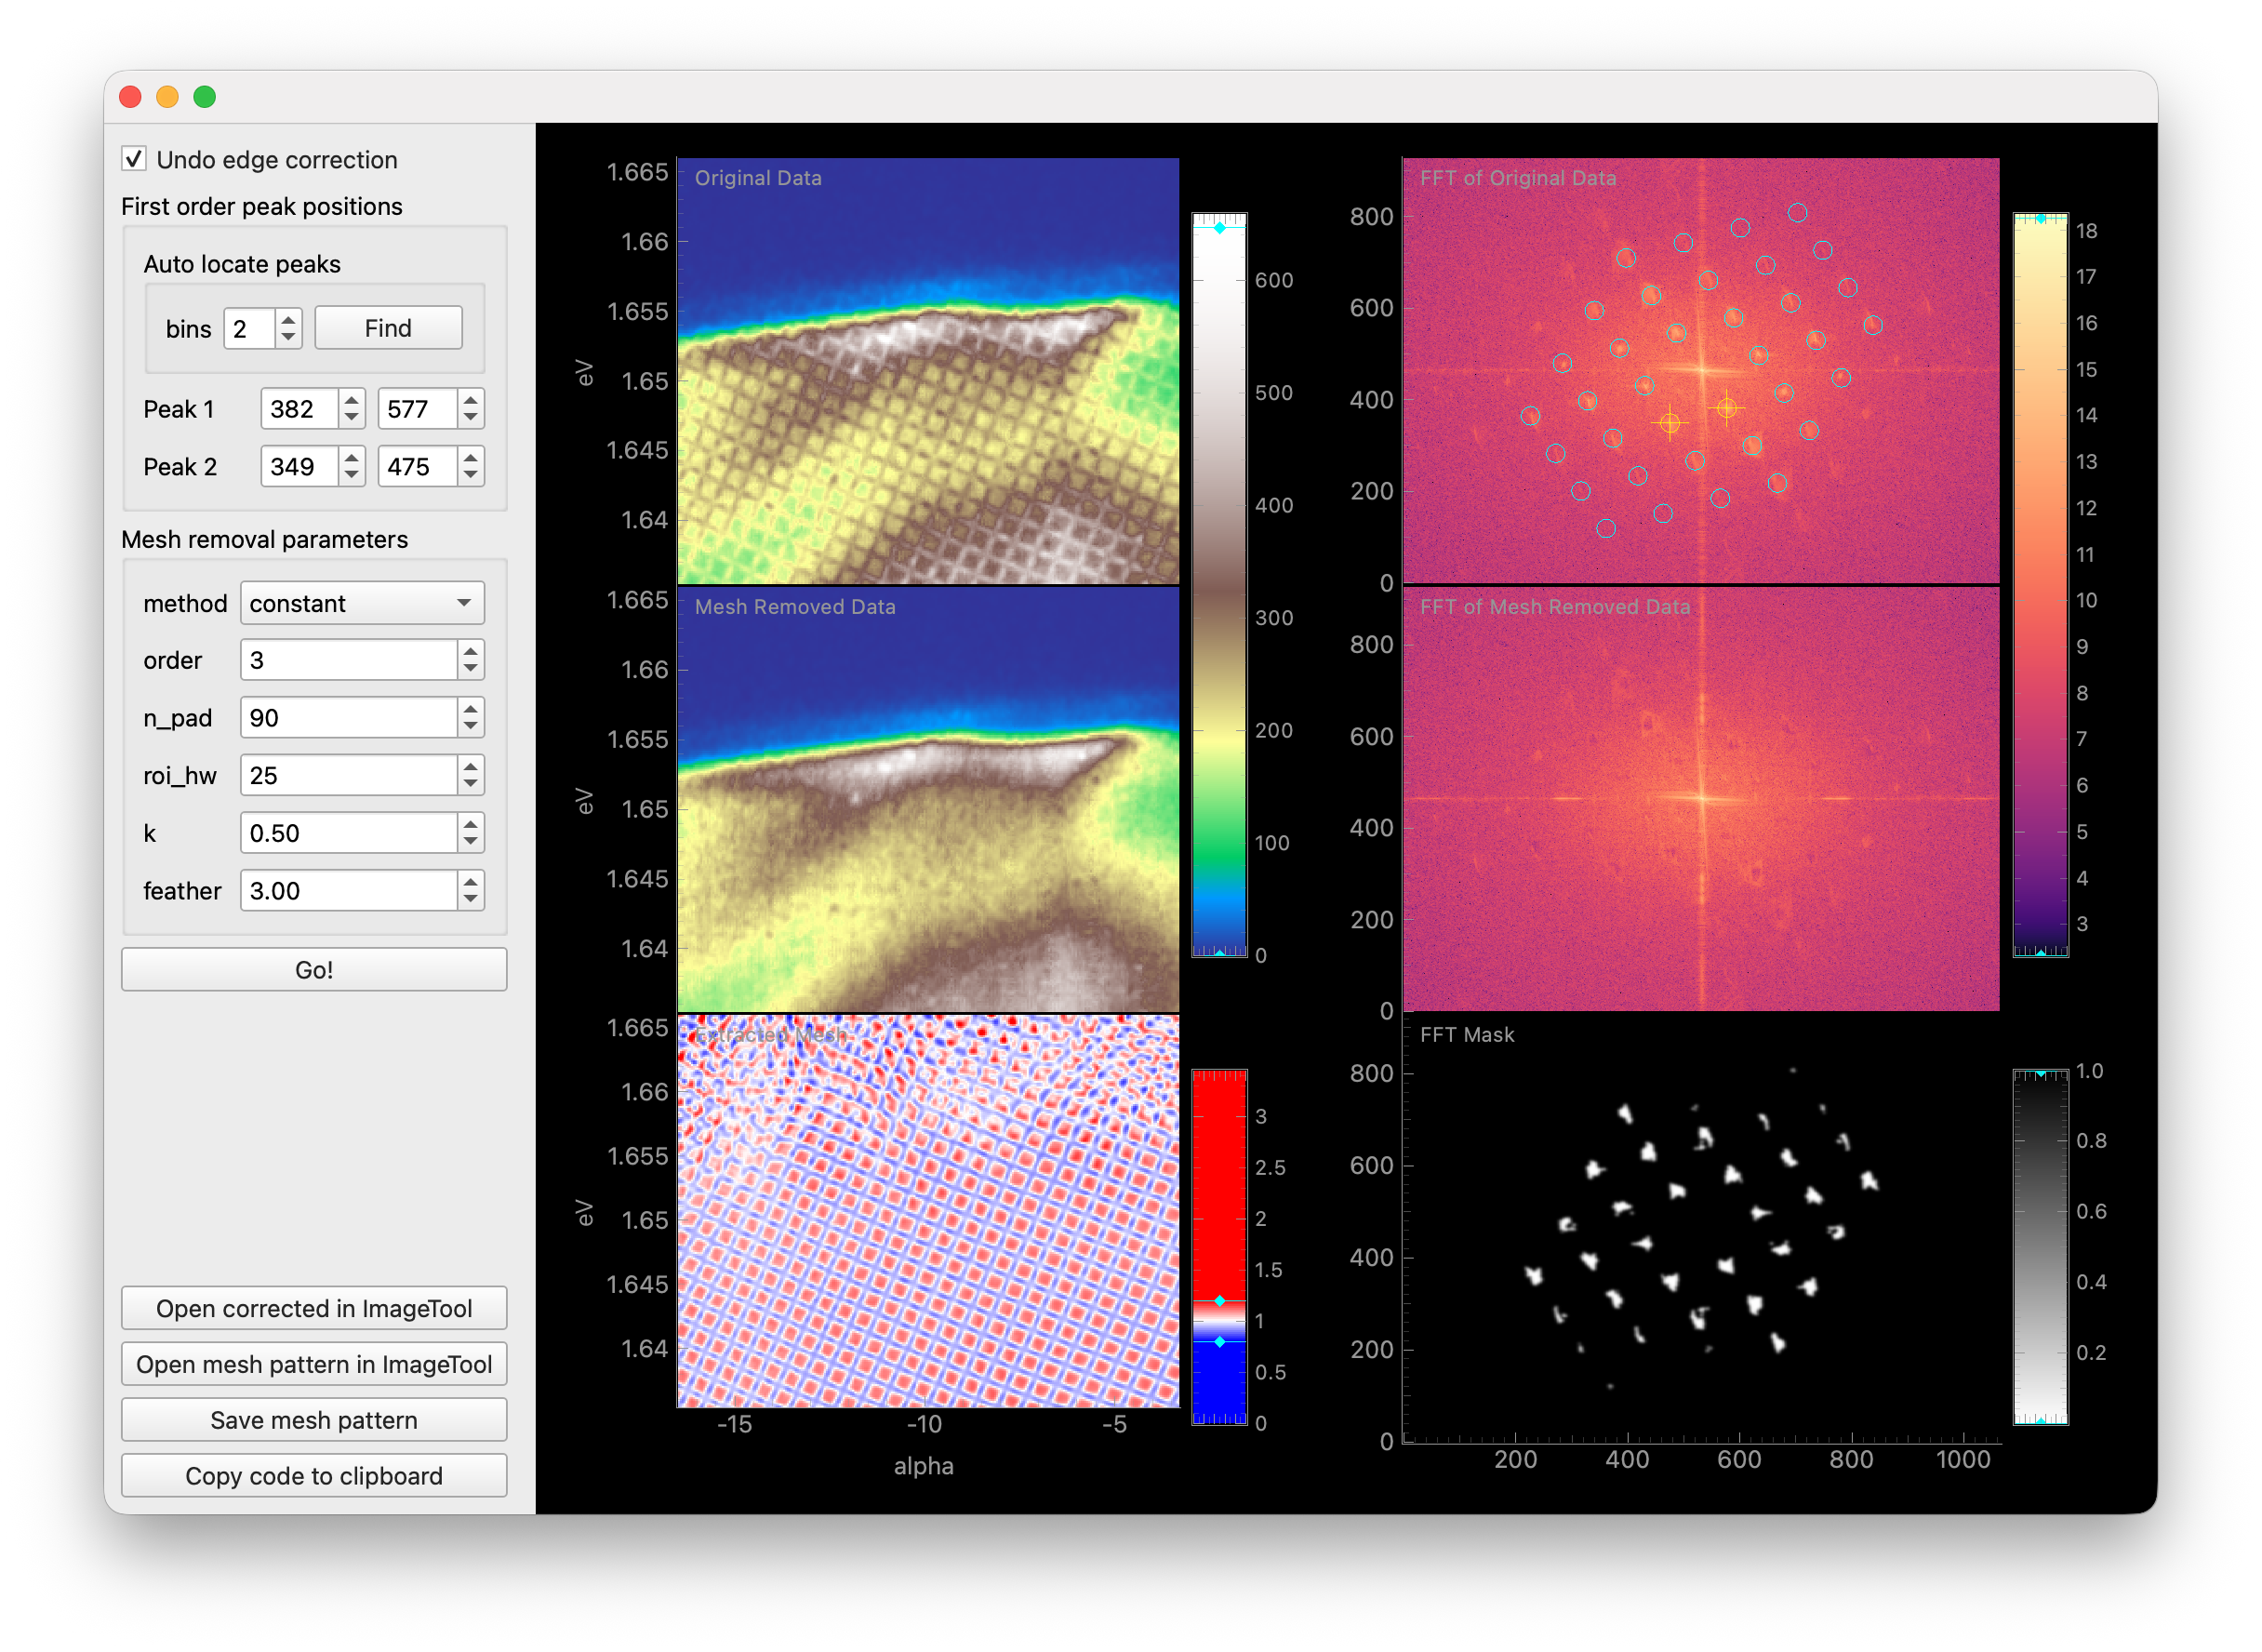
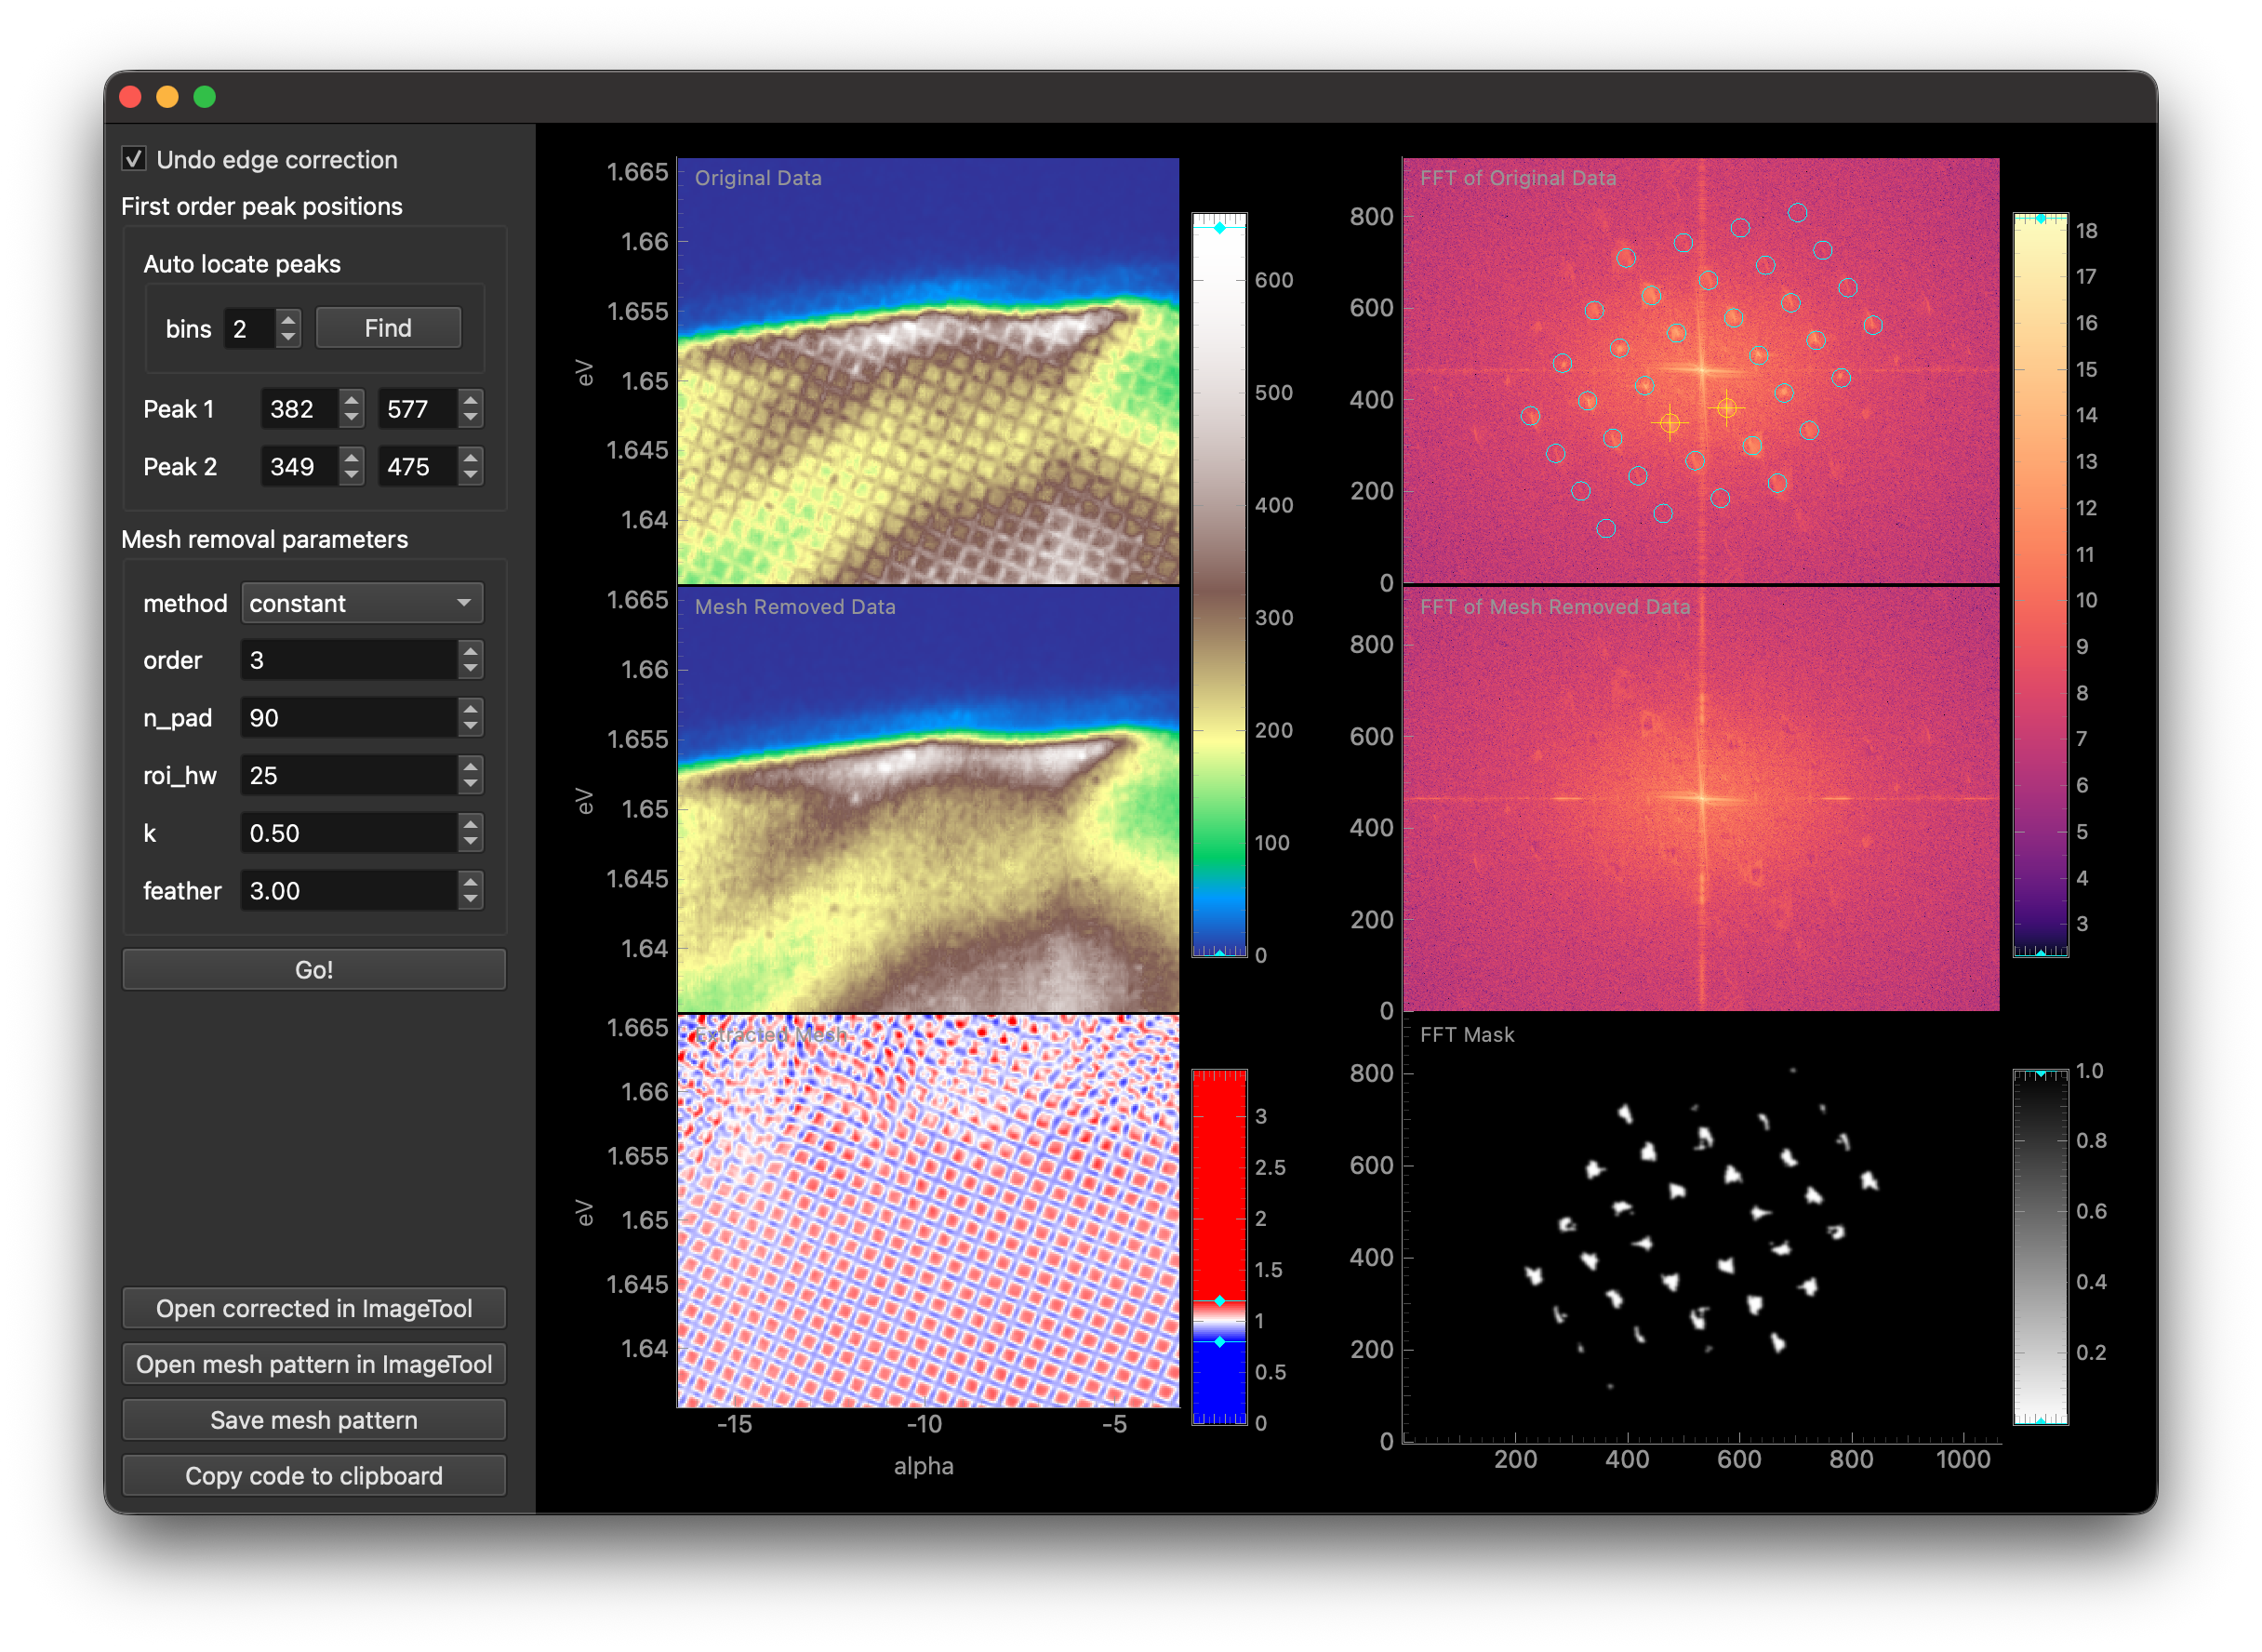
This tool accepts any DataArray with eV and alpha dimensions. When additional dimensions are present, the data will be averaged over those dimensions to detect the mesh pattern. The original data will be corrected using the detected mesh parameters.
The first checkbox enables/disables undoing of software edge correction for straight analyzer slits that some analyzers apply automatically (currently only tested with Scienta DA30L).
In the next section, you must specify the location of the first order mesh peaks in the FFT of the data.
Place the two yellow targets on the FFT plot over the two first order mesh peaks by dragging them with the mouse.
Alternatively, an automatic search can be performed by clicking Find under Auto locate peaks.
In the final section, several parameters for mesh removal are provided. For more information on these parameters, see the documentation for
erlab.analysis.mesh.remove_mesh(). You may have to experiment with these parameters to achieve optimal results for your dataset.Once you are satisfied with the parameters, click Go! to perform mesh removal.
Note
Mesh removal is currently experimental and may not work well for all datasets, and may introduce unwanted artifacts. Please use with caution and verify the results carefully.
Data explorer
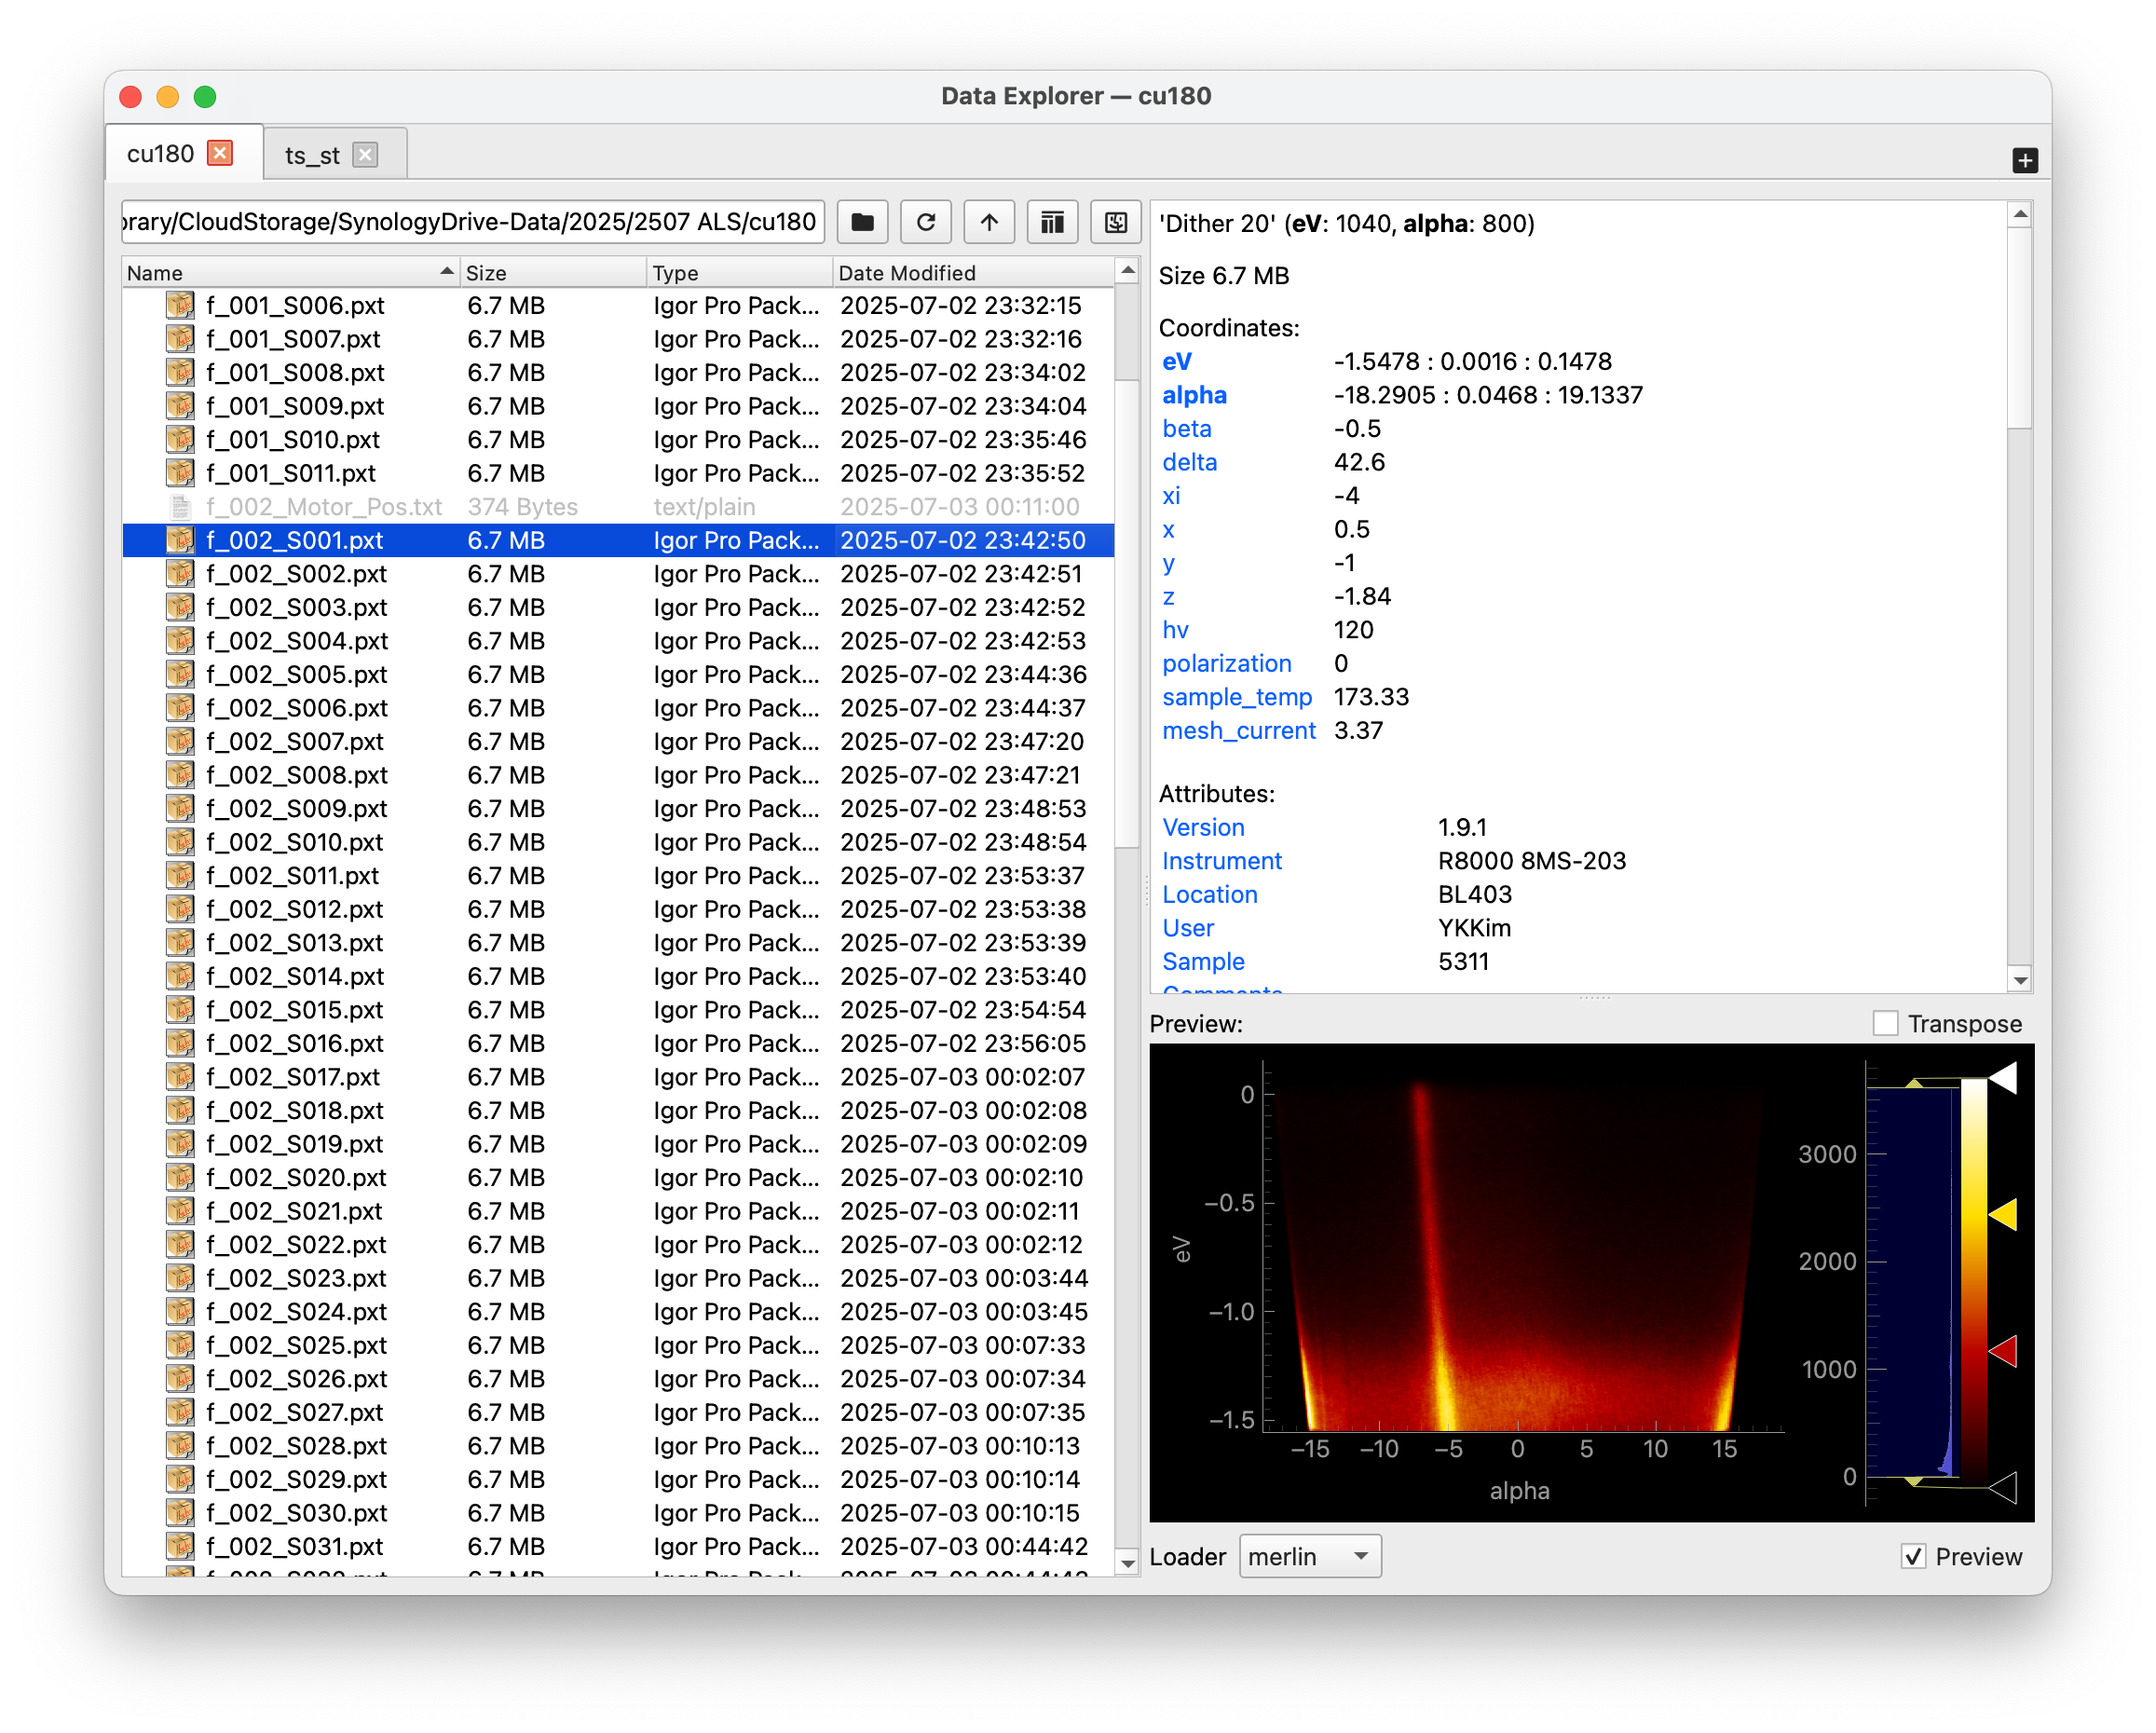
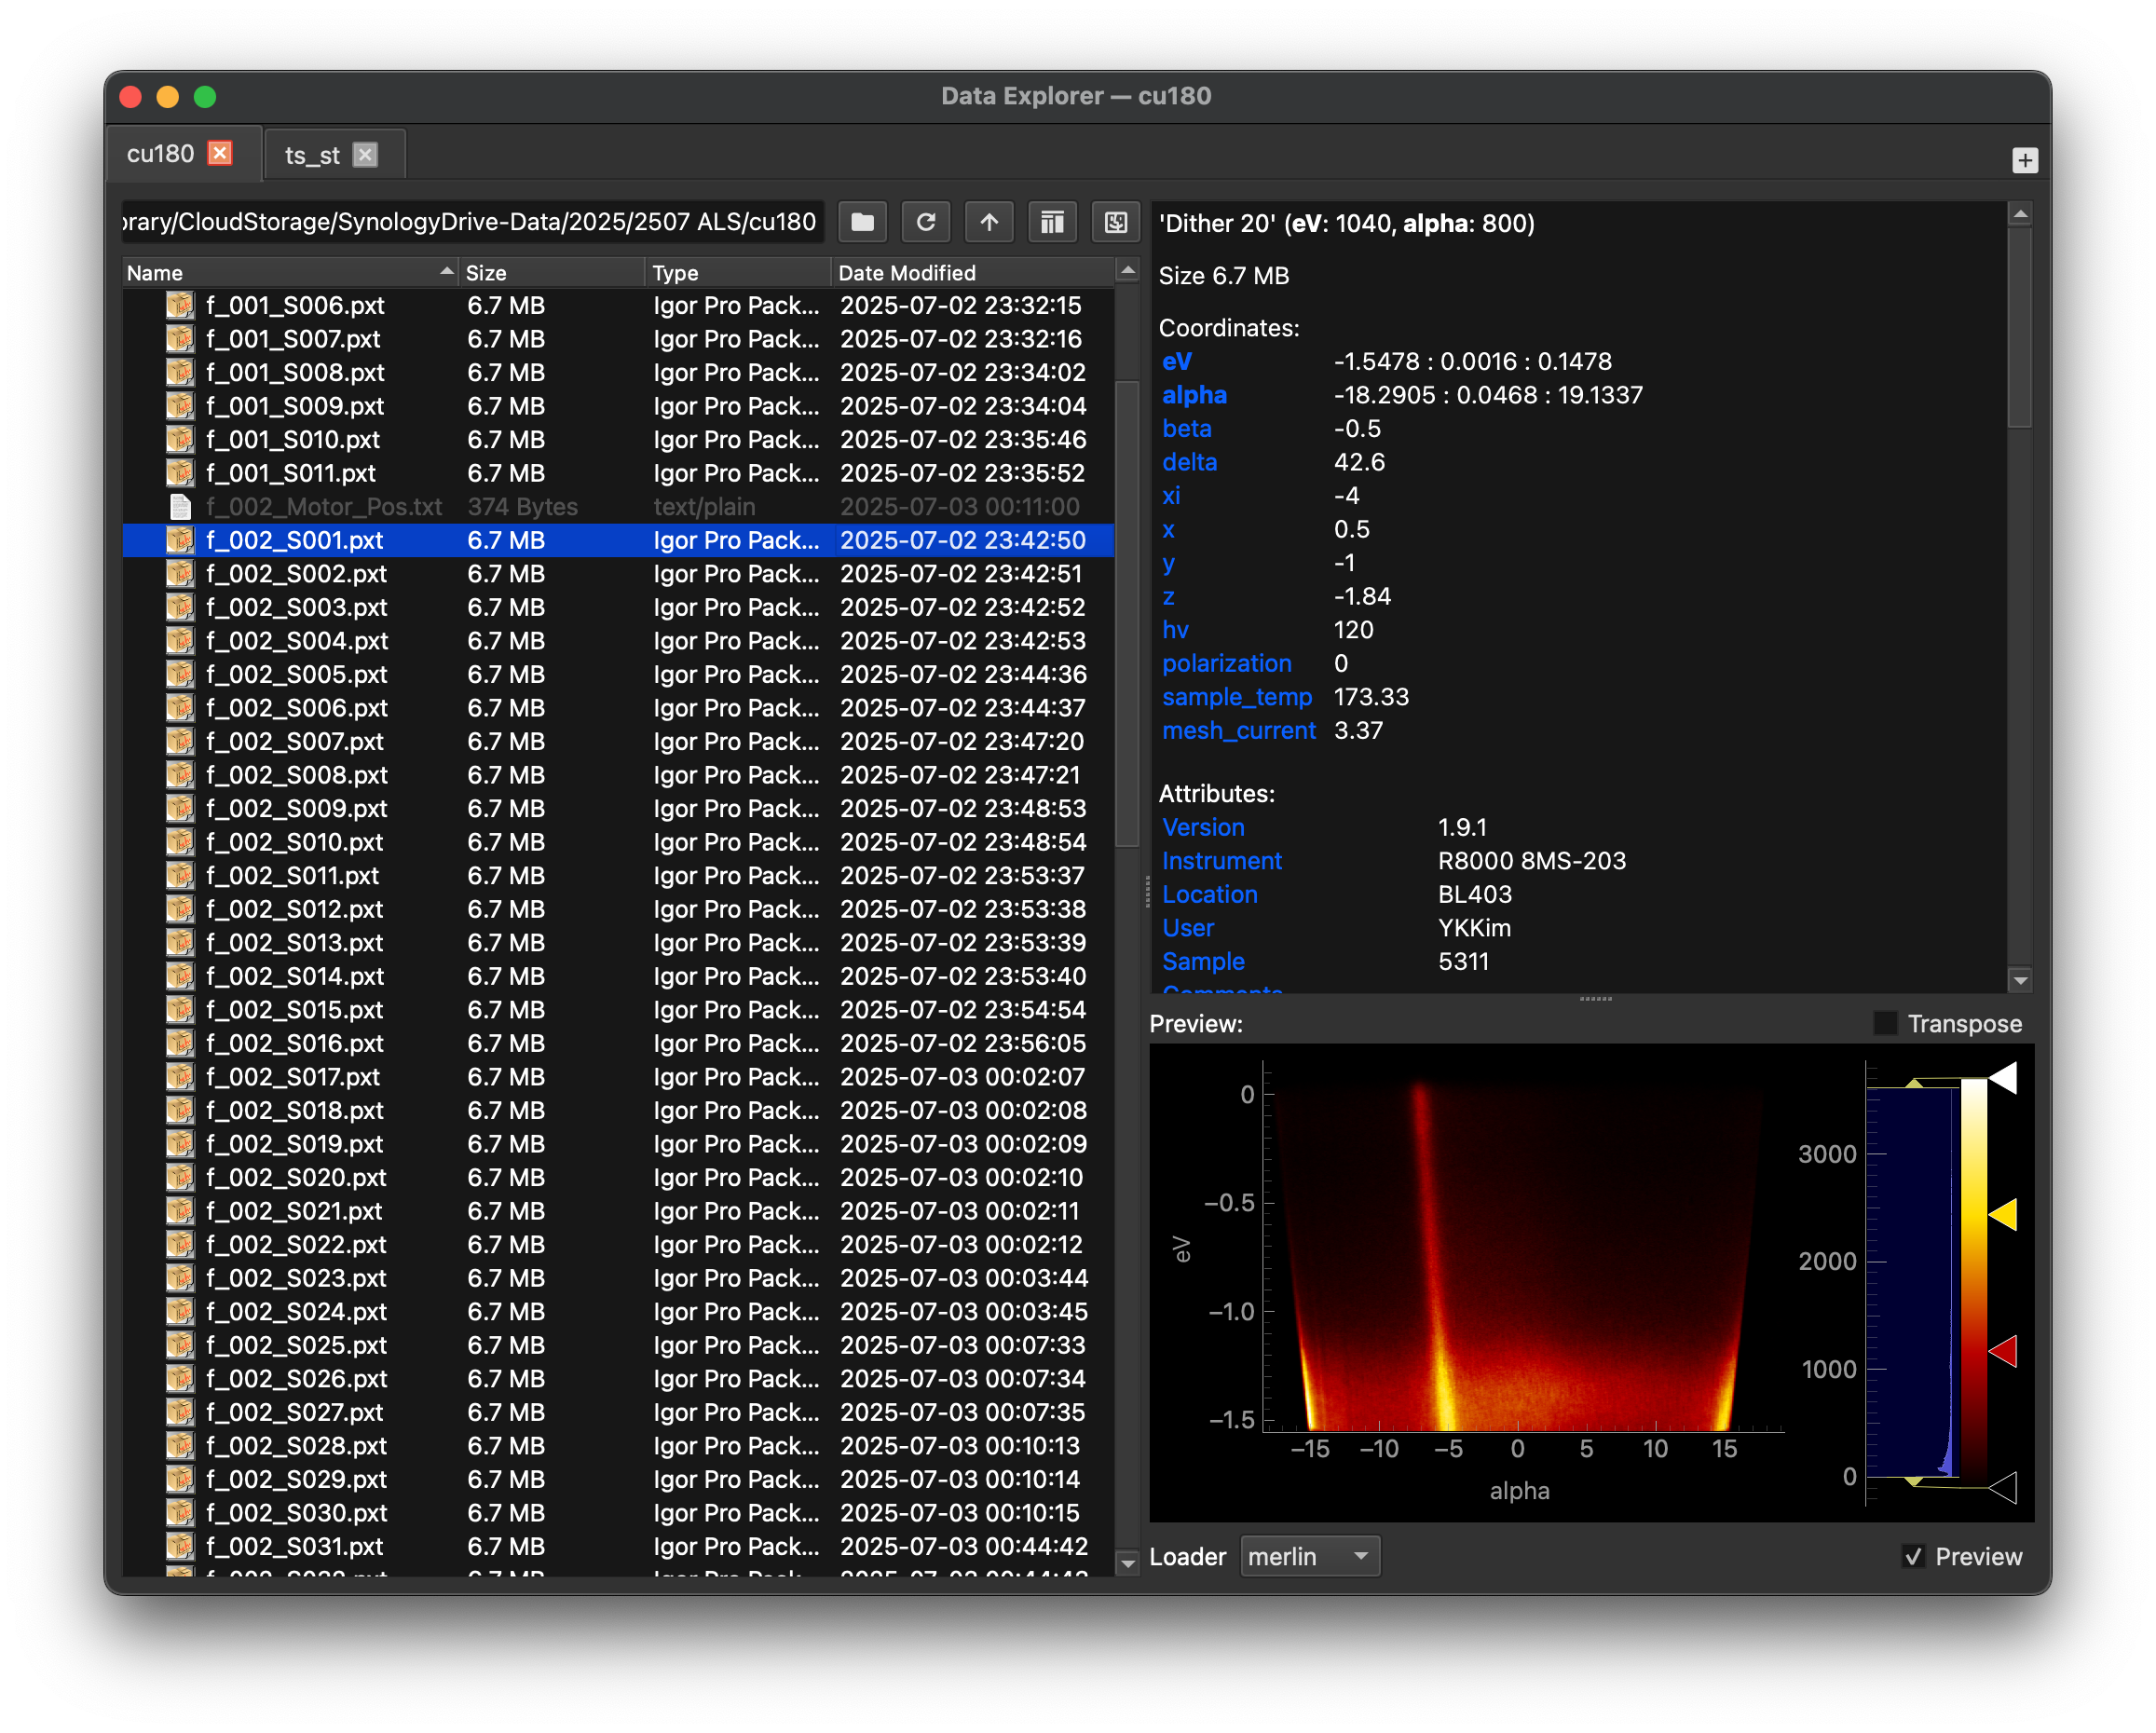
Provides a file-browser-like interface for exploring and visualizing ARPES data stored on your disk. See erlab.interactive.data_explorer() for more information.
BZPlotter
This tool is not an analysis tool, but rather a utility for creating plots of three-dimensional Brillouin zones and exporting them as vector graphics.
The GUI can be invoked with erlab.interactive.bzplot.BZPlotter:
import erlab.interactive as eri

eri.bzplot.BZPlotter()
Once opened, a matplotlib figure window will appear alongside a control panel for adjusting the lattice parameters. The figure can be rotated interactively using the mouse, and the plot can be exported as any of the formats supported by matplotlib via the standard matplotlib save button.
Notebook shortcuts
Loading the :mod:erlab.interactive IPython extension (%load_ext erlab.interactive) registers convenient line magics for quickly launching the various interactive tools from within a Jupyter notebook or IPython console.
%ktool --cmap viridis darr.sel(eV=0)

%dtool darr

%goldtool darr.isel(beta=1)

%restool darr.mean(dim='kx')