ImageTool
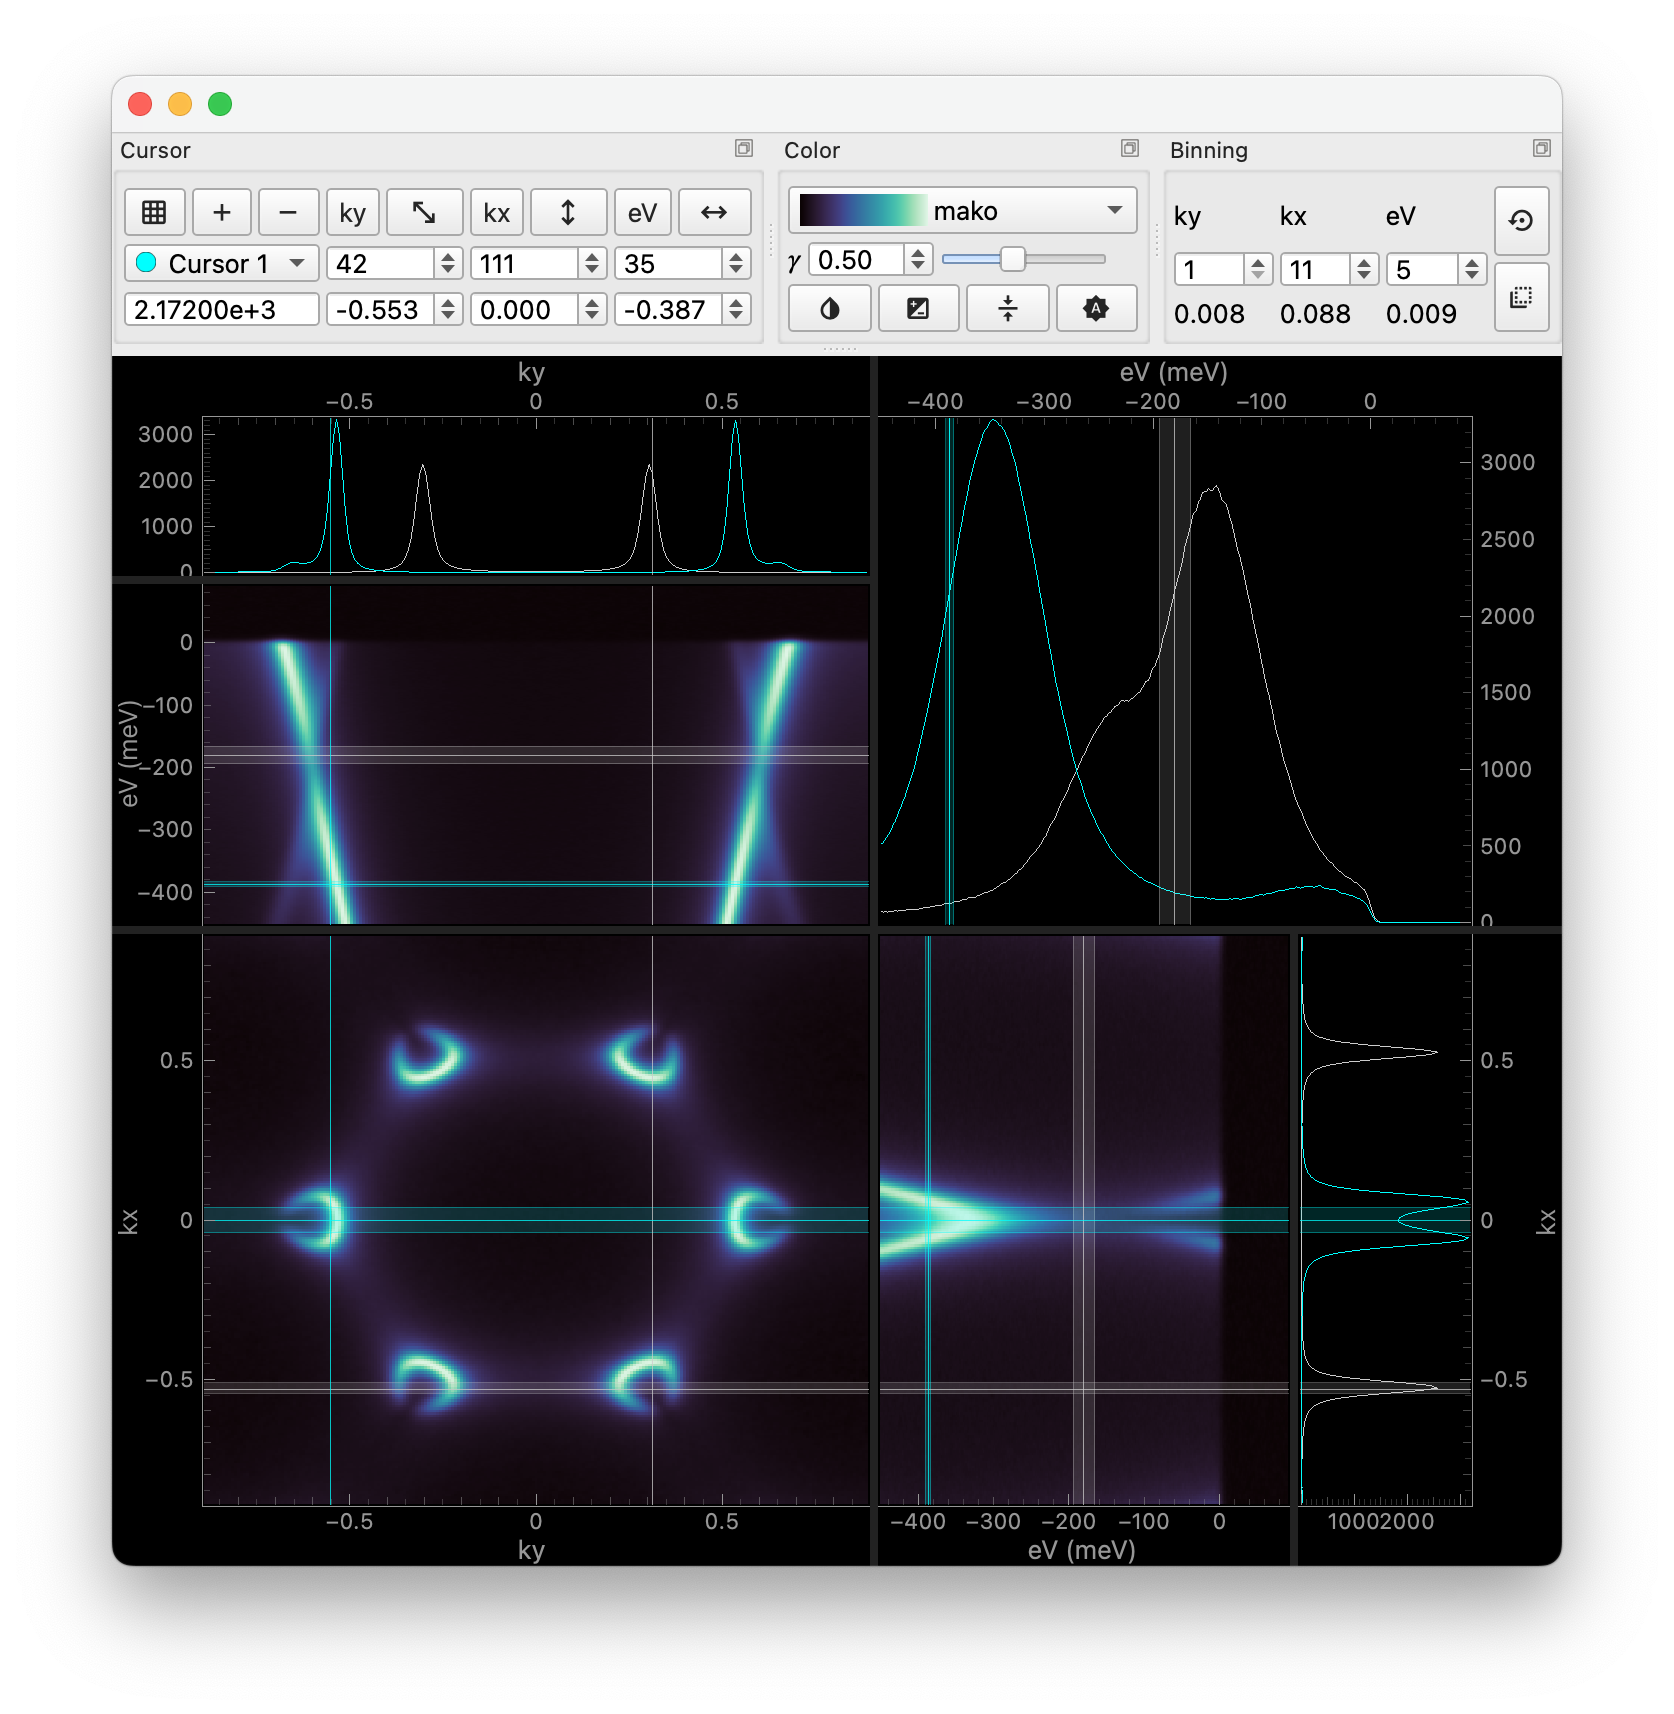
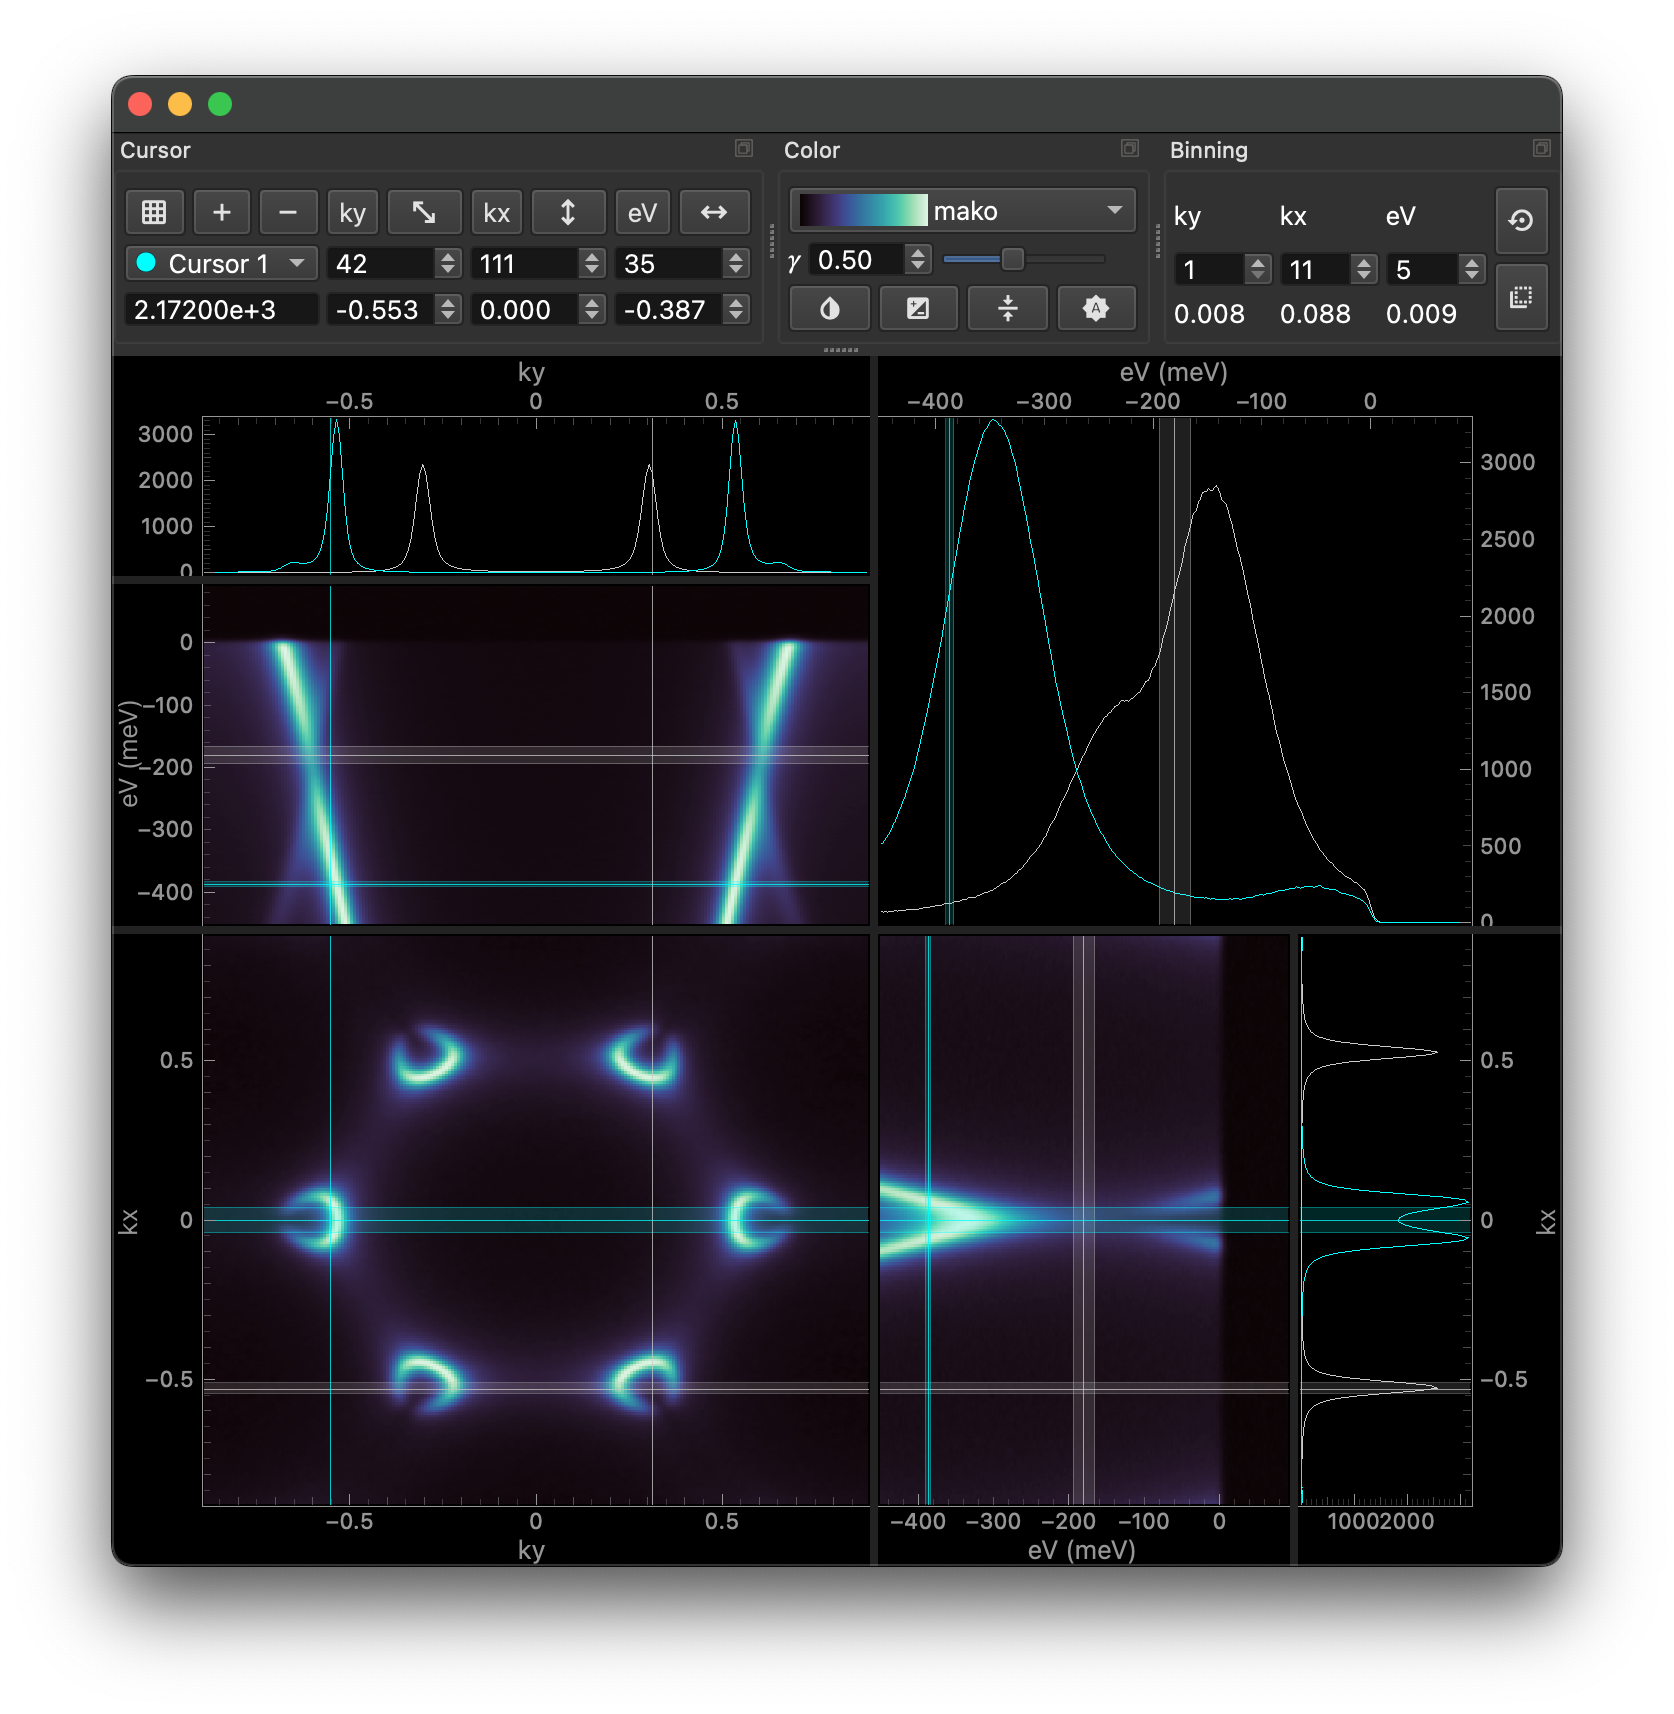
The ImageTool window
Inspired by Image Tool for Igor Pro written by the Advanced Light Source at Lawrence
Berkeley National Laboratory, ImageTool
is a simple tool exploring images interactively.
Features
Zoom and pan
Real-time slicing & binning
Multiple cursors
Easy size adjustment
Advanced colormap control
Interactive editing like rotation, normalization, cropping, momentum conversion, and more
Displaying data in ImageTool
ImageTool supports image-like xarray.DataArrays from 2 to 4 dimensions.
Non-uniform coordinates are converted to index arrays automatically, and are suffixed
with _idx.
There are three ways to display data in ImageTool:
-
import erlab.interactive as eri
eri.itool(data)
The
xarray.DataArray.qshow()accessor:data.qshow()
Note that
datamust be an image-likexarray.DataArray.(In an interactive session) Use the IPython magic command
%itool:If you are in an interactive session such as IPython and Jupyter notebook, you can use the
%itoolmagic command to display an object in ImageTool. Before using this command, you must first load the IPython extension:%load_ext erlab.interactive
Then, you can use the
%itoolcommand to display data in ImageTool:%itool data
This command is equivalent to calling
itool. Many arguments toitoolare also available as options. For example, you can specify to open the data in the ImageTool manager by using the--manageroption (or-mfor short):%itool -m data
For all supported arguments, display the help message by running
%itool?in an IPython session.
Tips
Hover over buttons for tooltips.
Most actions have associated keyboard shortcuts. Explore the menu bar to learn them.
Right-click on plots for context menus with options like copying slicing code, locking aspect ratio, exporting to a file, opening various tools, and more.
Hint
Holding Alt inside the context menu will transform some menu items to work with the data cropped to the currently visible area.
Cursor controls
: snap cursors to pixel centers.
and : add and remove cursors.
Color controls
: lock color range and display a colorbar.
When toggled on, the color range is locked to the minimum and maximum of the entire data.
The color range can be manually set by dragging or right-clicking on the colorbar.
: scale the colormap gamma with respect to the midpoint of the colormap, similar to
CenteredPowerNorm.: switch between scaling behaviors of
PowerNormandInversePowerNorm.You can choose different colormaps from the colormap dropdown menu. Only a subset of colormaps is loaded by default. To load all available colormaps, right-click on the colormap dropdown menu and select “Load All Colormaps”.
Binning controls
: reset all bin widths to 1.
: Apply binning changes to all cursors.
In the “Edit” and “View” menu bar items, you can find various options to edit and transform the data, such as rotating, symmetrizing, and cropping. Try them out!
ImageTool is extensible. At our home lab, we use a modified version of ImageTool to plot data as it is being collected in real-time!
Keyboard shortcuts
Some shortcuts that are not shown in the menu bar. Mac users must replace Ctrl with ⌘ and Alt with ⌥.
Shortcut |
Description |
|---|---|
LMB Drag |
Pan |
RMB Drag |
Zoom and scale |
Ctrl+LMB Drag |
Move active cursor |
Ctrl+Alt+LMB Drag |
Move all cursors |
Alt while dragging a cursor line |
Move all cursor lines |
Rule of thumb: hold Alt to apply actions to all cursors. Shortcuts for ‘shifting’ a cursor involves the Shift key.
Using the ImageTool manager
ImageTools can also be used as a standalone application with ImageToolManager.
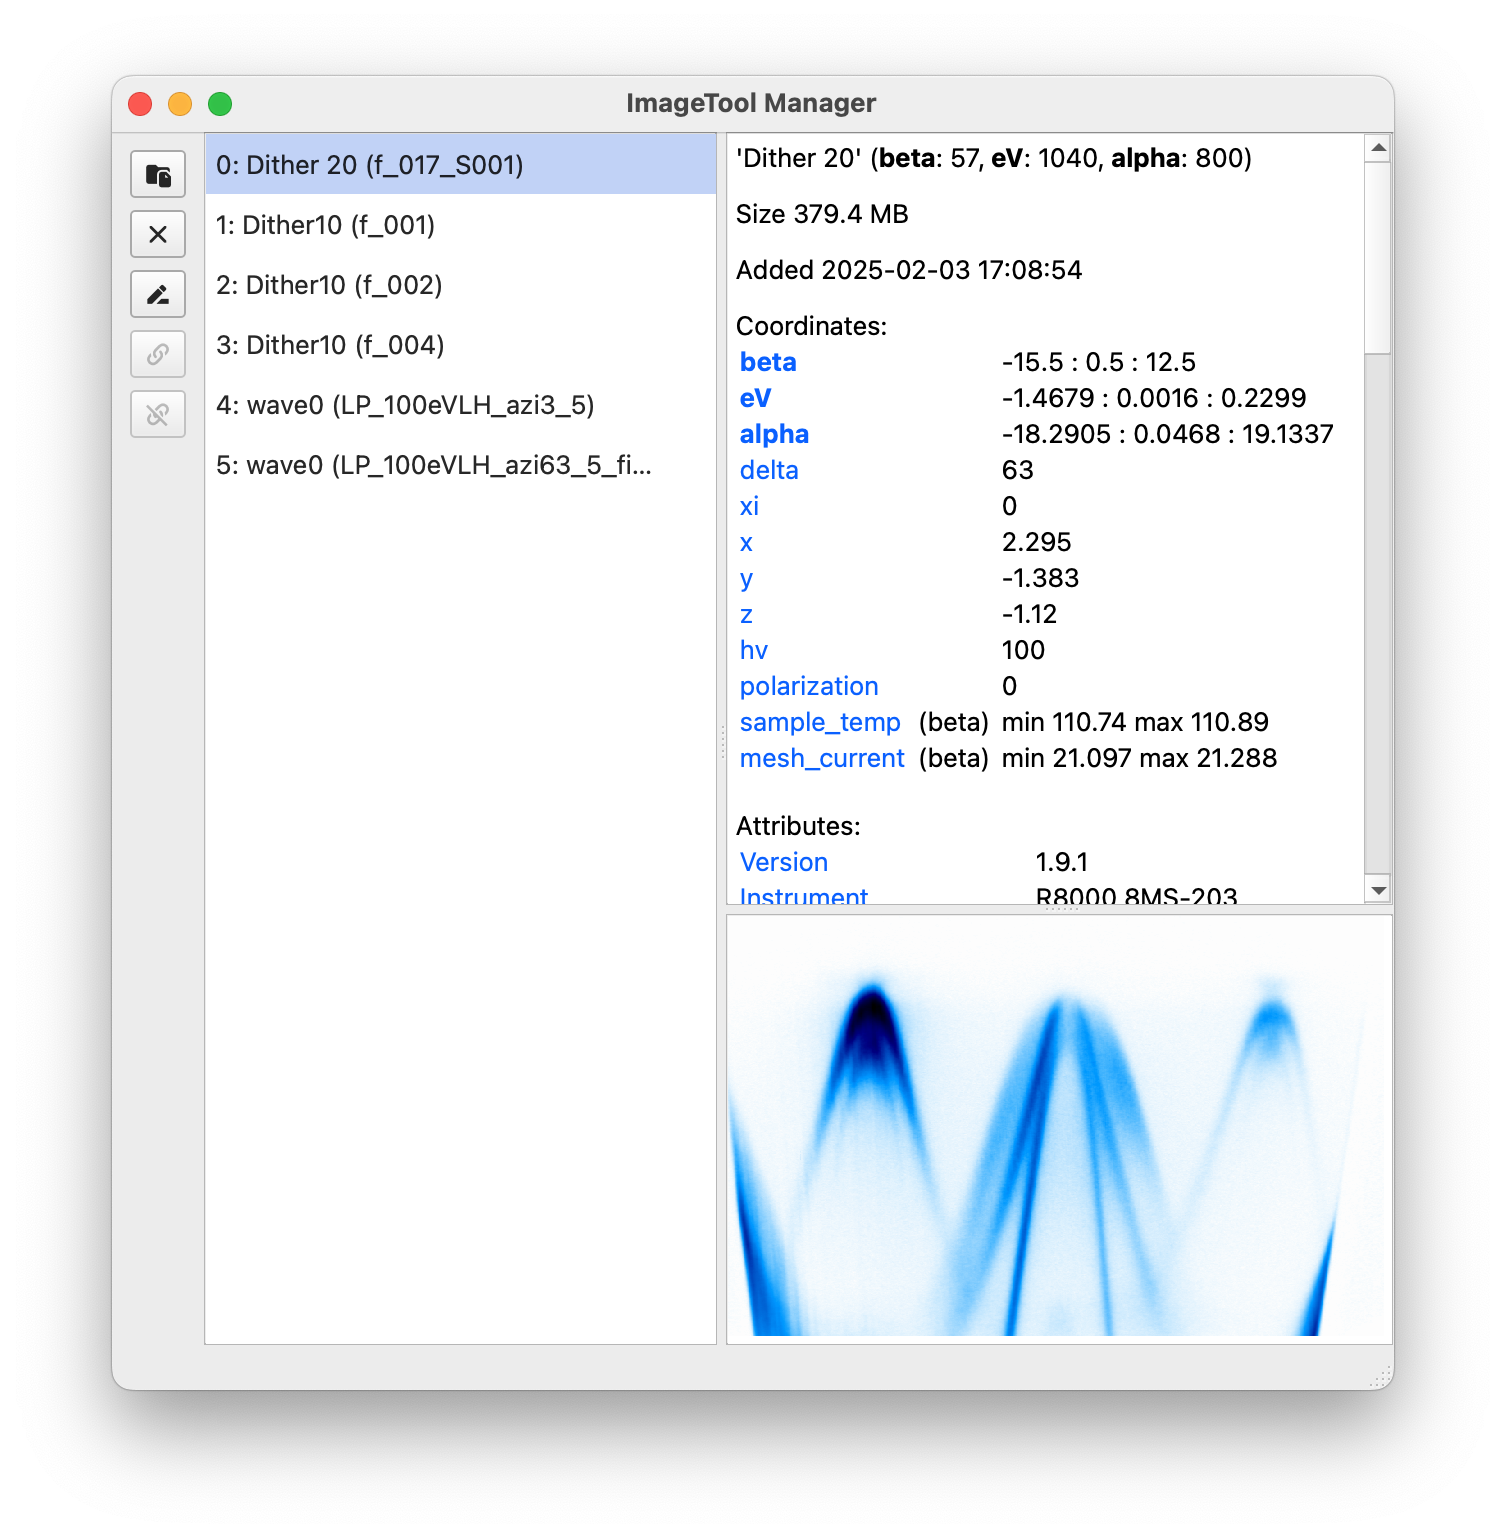
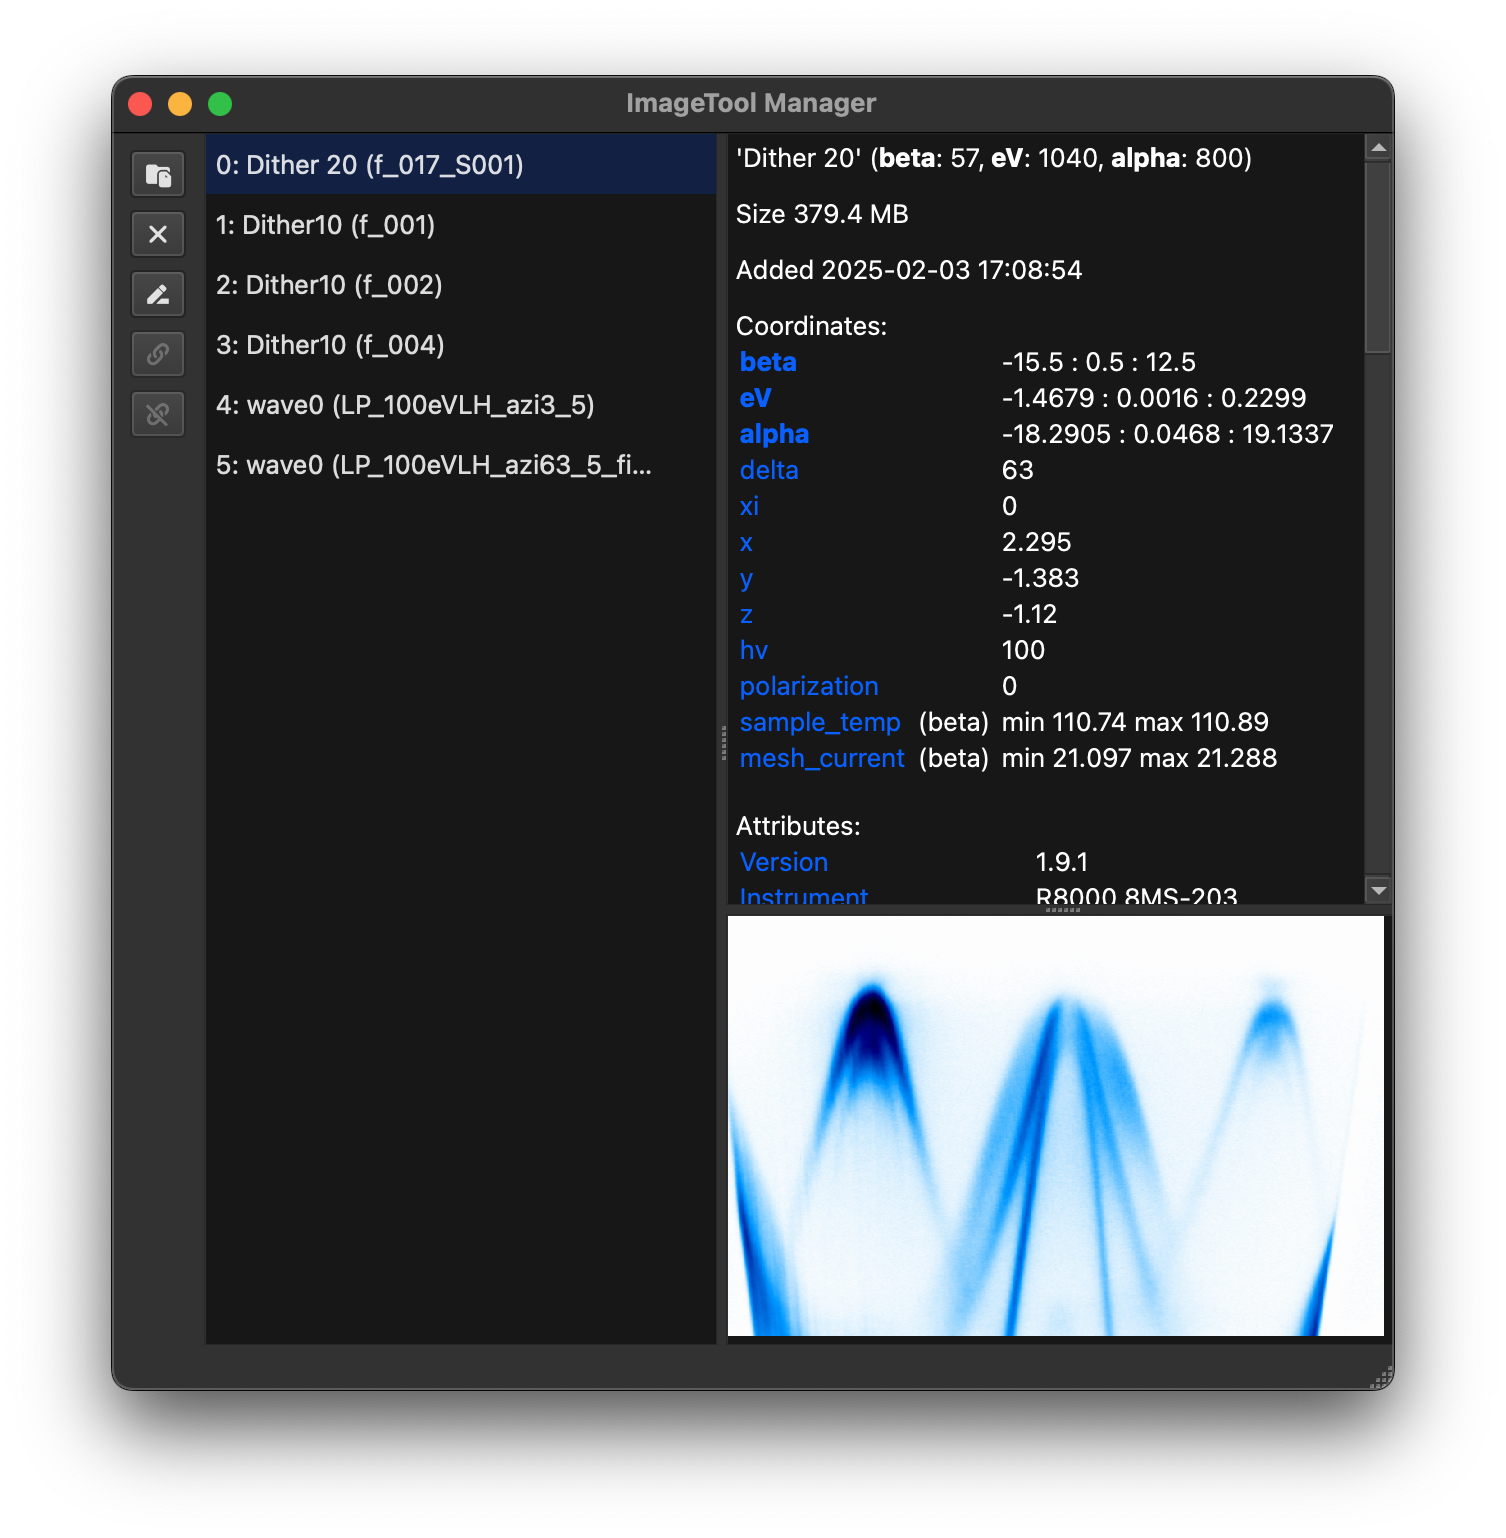
The manager shows a list of opened ImageTool windows along with some buttons. Information and preview about the data displayed in the currently selected ImageTool is shown in the right panel.
Hint
Hovering your mouse over each button will show a brief description of its function.
Starting the manager
Run itool-manager in a terminal or command prompt window with ERLabPy installed.
Note
Only one manager can run per machine.
Sending data to the manager has slight overhead, noticeable for large data.
Adding ImageTool windows
When the manager is running, new data can be opened in the manager by:
Invoking ImageTool from
itoolorxarray.DataArray.qshow()withmanager=Truefrom any script or notebook.darr.qshow(manager=True)
The
Move to Manager(Ctrl+Shift+M) action in theFilemenu from an ImageTool window opened without specifyingmanager=True. This action moves the active ImageTool to the manager.Opening supported files through the
Filemenu in the manager.Dragging and dropping supported ARPES data into the manager window.
In the dialog that appears, you can choose the plugin to use for loading the data.
Hint
For scans that are recorded across multiple files, drag and dropping any file in the scan will automatically load and concatenate the entire scan. If you want to load only the file you dropped, choose the plugin suffixed with “Single File” in the dialog.
Additional features
Save all ImageTool windows to a file via the
Save Workspace As...menu item.The saved windows can be restored later with
Open Workspace...or by dragging and dropping the file into the manager.The manager has a built-in iPython console to manipulate ImageTool windows and data, and run Python code.
Toggle the console with ⌃+` (Mac) or Ctrl+` (Windows/Linux) or through the
Viewmenu.Toggle the
Preview on Hoveroption in theViewmenu to show a preview of the main image when hovering over each tool.After selecting multiple tools, you can perform actions on all selected tools at once using the right-click context menu.
Selecting
Concatenatefrom the right-click context menu will concatenate the data from all selected tools and open a new ImageTool window with the concatenated data. Seexarray.concatfor more information on concatenation.The manager has an integrated file browser to browse and preview data files. It can be invoked from the
Filemenu of the manager, or with the keyboard shortcut Ctrl+E.See
erlab.interactive.explorerfor more information.Explore the menu bar for more features!
Working with notebooks
Opening data in the manager from a notebook is straightforward, as shown above. However, you may wish to send data from the manager to a jupyter notebook for further analysis.
This is easily done using the %store magic command.
Suppose you want to store the data displayed in a tool with index 0. First select the
tool in the manager. Then, trigger the Store with IPython action from the
right-click context menu or the File menu. This will open a dialog to enter a
variable name. Enter a variable name (e.g., my_data) and click OK.
Note
This is equivalent to running the following code in the manager console:
my_data = tools[0].data
%store my_data
Now, in any notebook, you can retrieve the data by running:
%store -r my_data
after which the data will be available as my_data in the notebook.