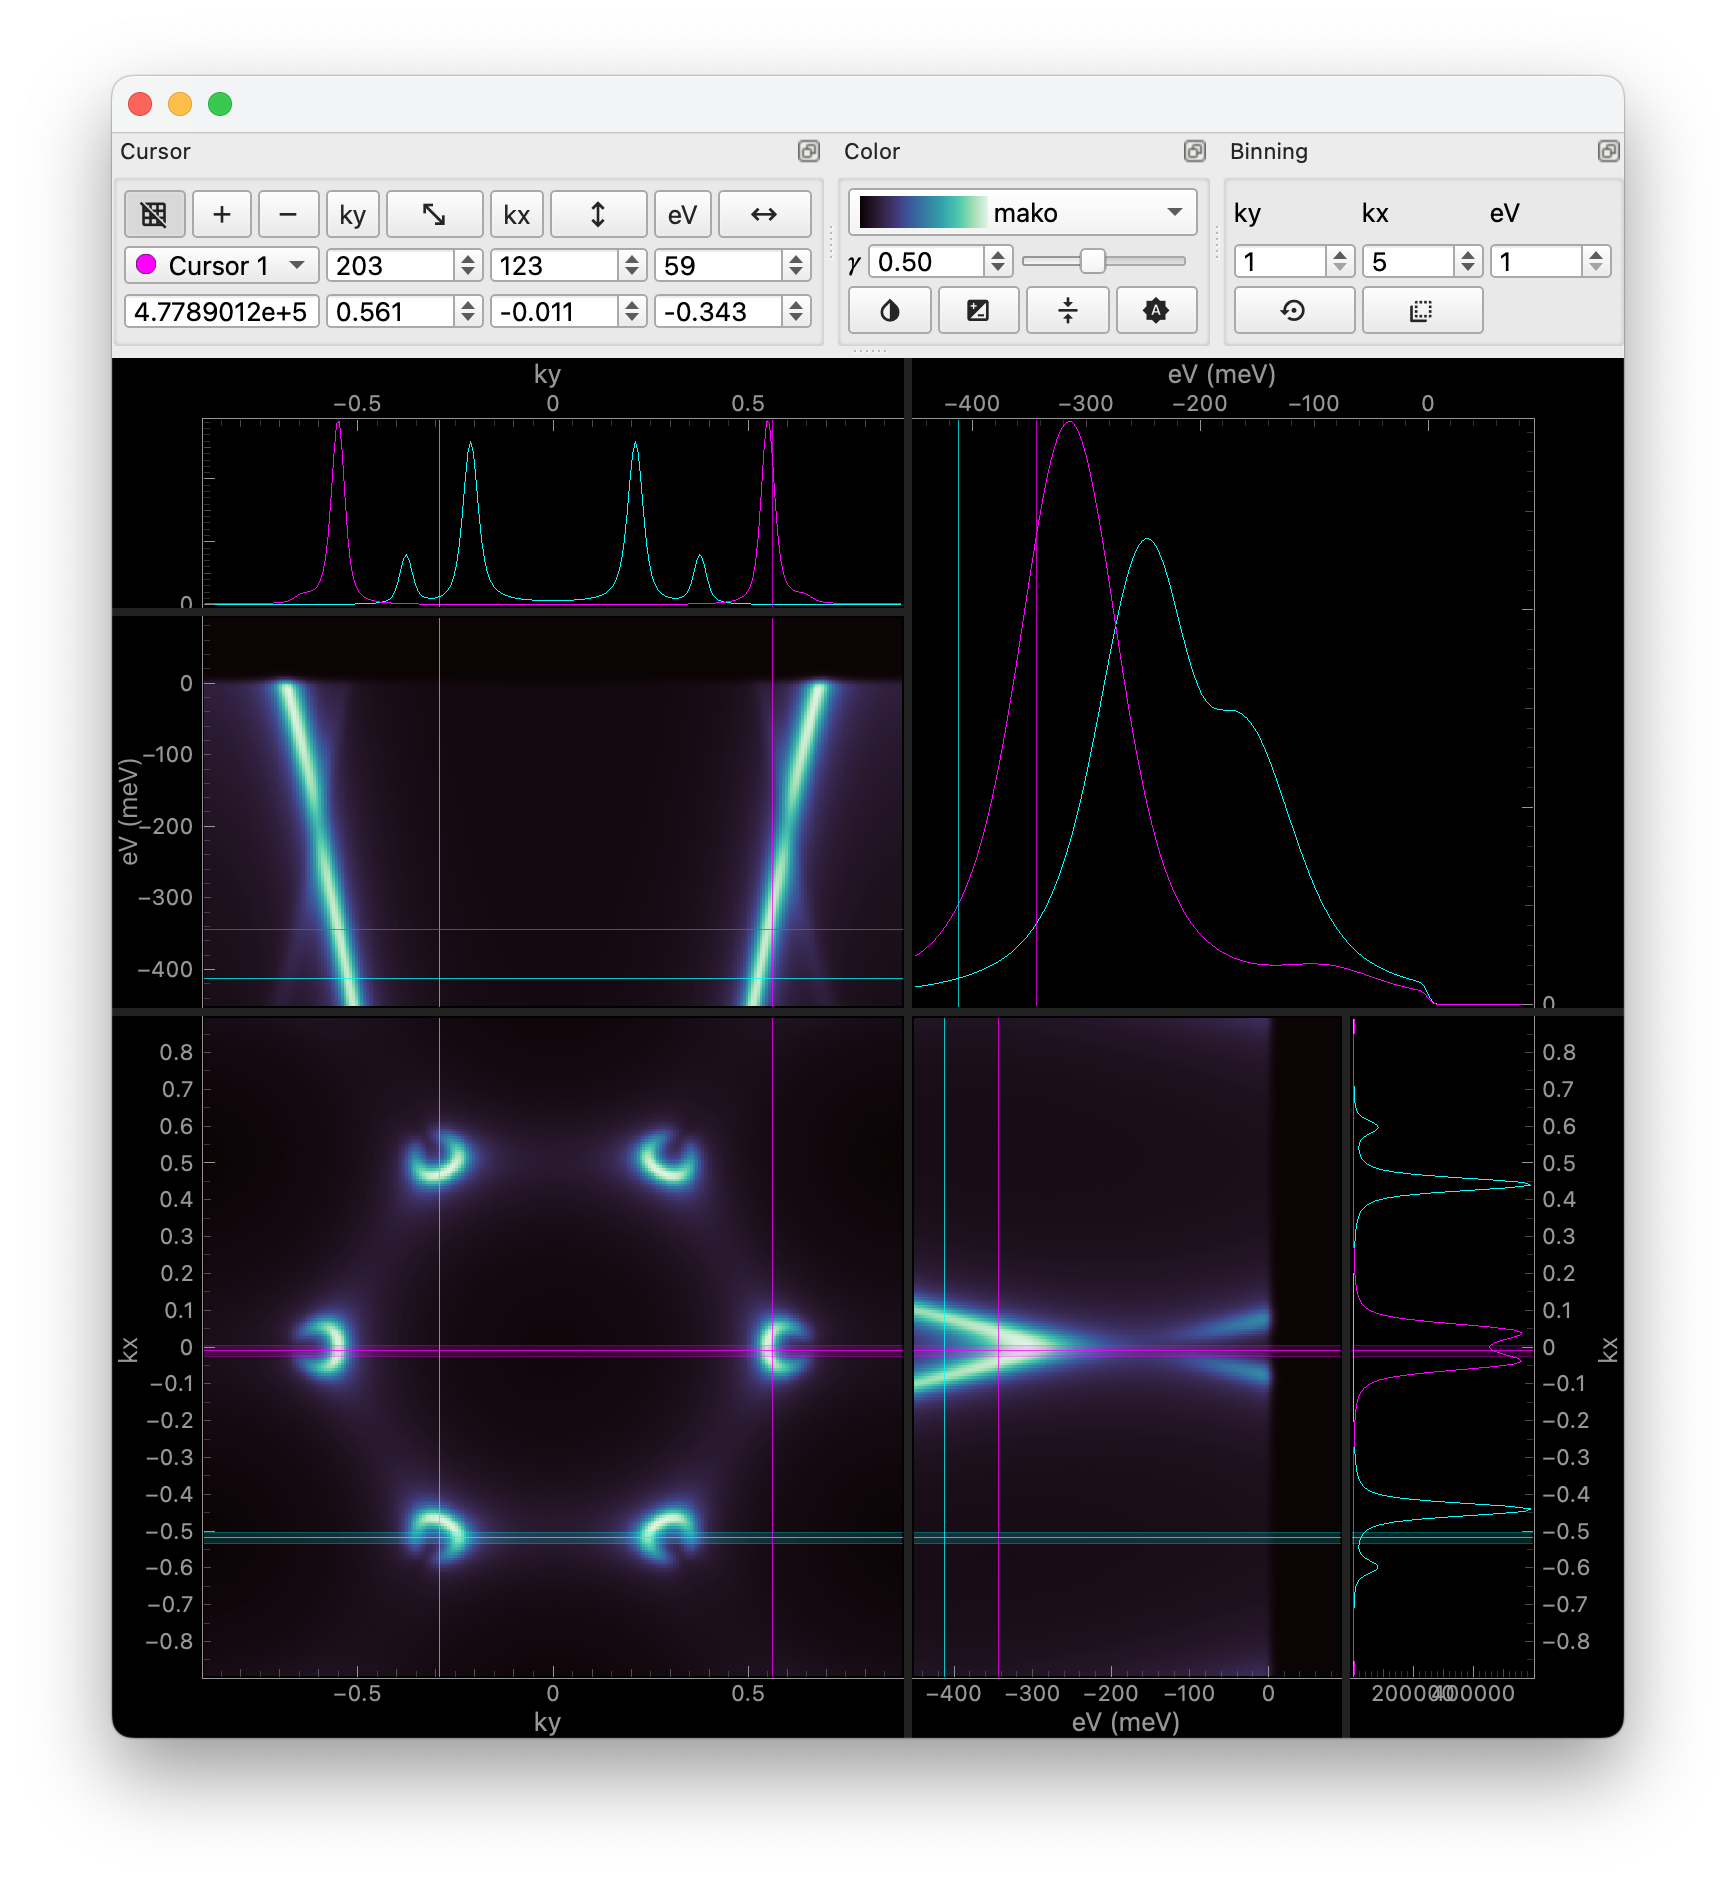
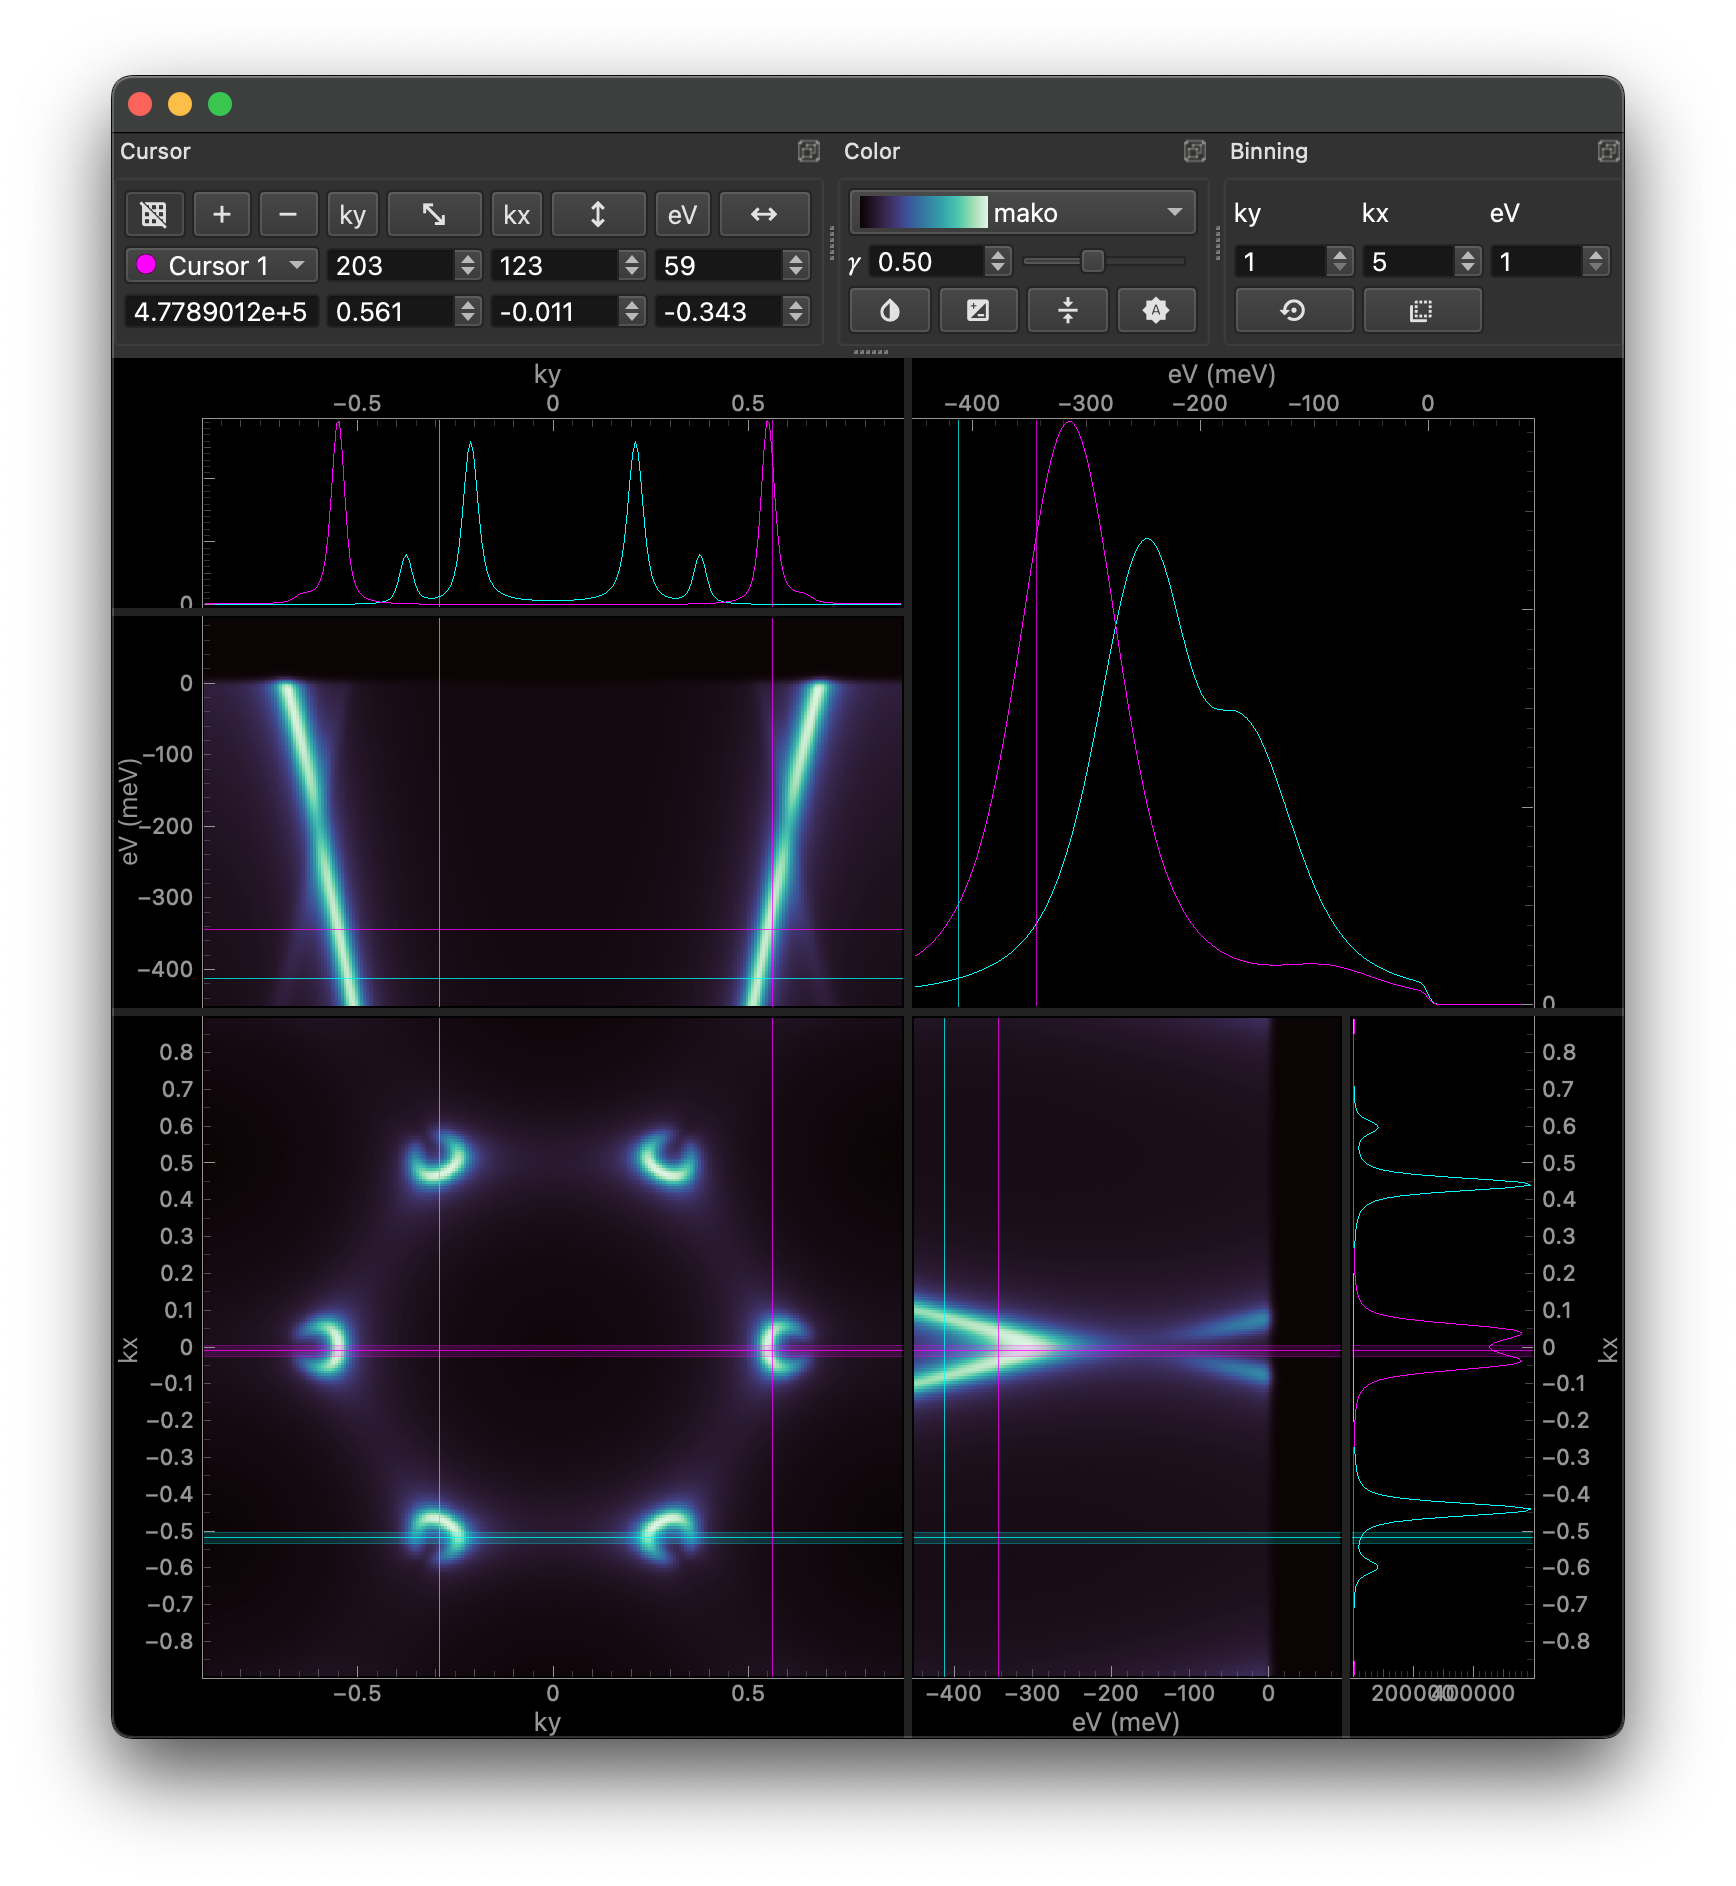
Using ImageTool
Inspired by Image Tool for Igor Pro written by the Advanced Light Source at Lawrence
Berkeley National Laboratory, ImageTool
is a simple tool for interactively exploring images.
Features include:
Zooming and panning
Extremely fast and smooth data exploration
Real-time binning across multiple dimensions
Multiple cursors!
Easy and intuitive plot size adjustment with splitters
Advanced colormap control
ImageTool can be used to display image-like xarray.DataArrays ranging from
2 to 4 dimensions. If a coordinate of the input data happens to be non-uniform, it will
automatically be converted to an index array so that the data can be displayed.
There are two main ways to invoke the ImageTool. First is to call the itool convenience function, which will create a new
ImageTool instance and handle the event loop execution:
import erlab.interactive as eri
eri.itool(data)
Another way is to use the qshow accessor:
data.qshow()
Tips
If you don’t know what a button does, many buttons have tooltips that will appear when you hover over them.
Right-clicking on each plot will bring up a context menu with various options. One useful option is
Copy selection codethat copies the selection code which can be quickly pasted to a Python script or Jupyter notebook to reproduce the sliced data. You can also save the data corresponding to each slice as a HDF5 file.ImageTool is also very extensible. At our home lab, we use a modified version of ImageTool to plot data as it is being collected in real-time!
Keyboard shortcuts
Hints for most keyboard shortcuts are displayed in the menu bar. Here, some shortcuts that are not found in the menu bar are listed. Mac users must replace Ctrl with ⌘ and Alt with ⌥.
Shortcut |
Description |
|---|---|
LMB Drag |
Pan around |
RMB Drag |
Zoom and scale |
Ctrl+LMB Drag |
Move current cursor around |
Ctrl+Alt+LMB Drag |
Move all cursors around |
Alt while dragging a cursor line |
Make all cursor lines move together |